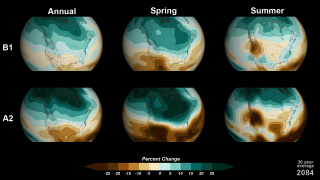
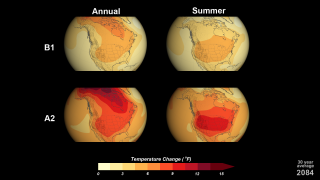
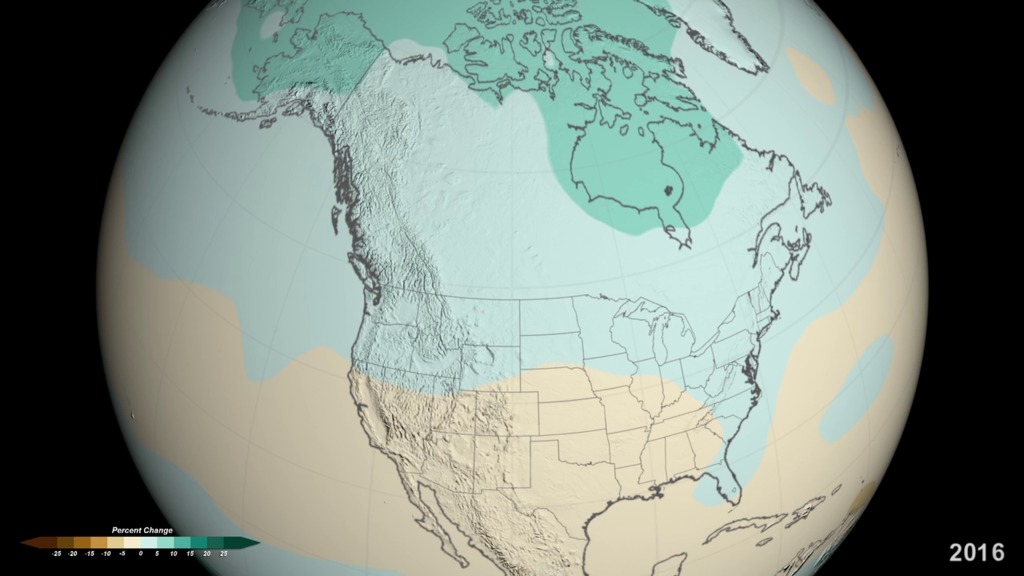
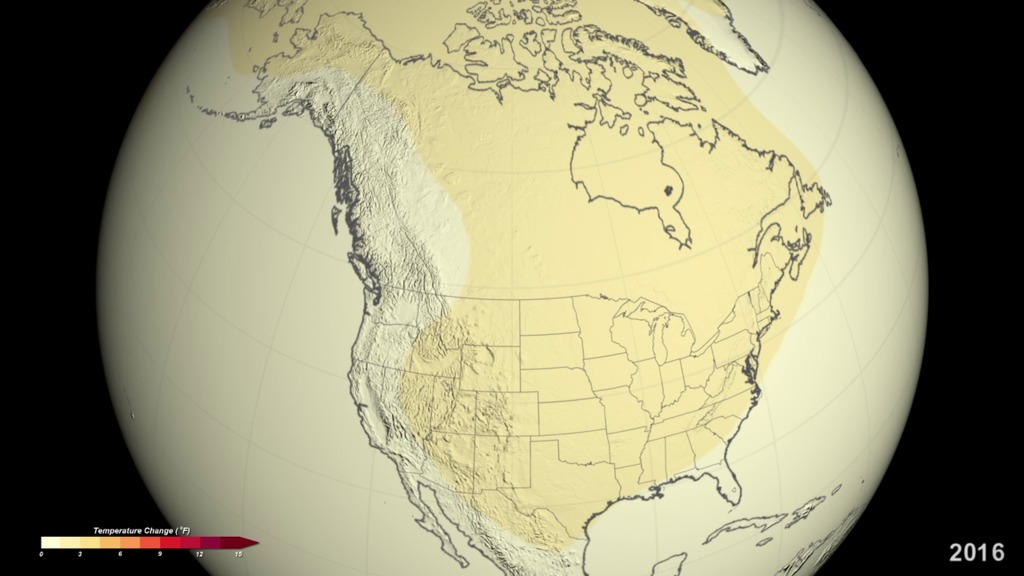
Projected U.S. Temperature and Precipitation Changes by 2100
The visualizations, which combine the results from 15 global climate models, present projections of precipitation and temperature changes from 2000 to 2100 compared to the historical average from 1970 - 1999. They were produced by the Scientific Visualization Studio at NASA's Goddard Space Flight Center, Greenbelt, Md., in collaboration with NOAA's National Climatic Data Center and the Cooperative Institute for Climate and Satellites, both in Asheville, N.C.
The visualizations show the precipitation and temperature changes as a 30-year running average. The date seen in the bottom-right corner is the mid-point of the 30-year average being shown.
"These visualizations communicate a picture of the impacts of climate change in a way that words do not," says Allison Leidner, Ph.D., a scientist who coordinates NASA's involvement in the National Climate Assessment "When I look at the scenarios for future temperature and precipitation, I really see how dramatically our nation's climate could change."
Related
For More Information
Credits
Kayvon Sharghi (USRA): Video Editor
Kayvon Sharghi (USRA): Producer
Patrick Lynch (Wyle Information Systems): Writer
NASA's Goddard Space Flight Center
https://svs.gsfc.nasa.gov/11316
This item is part of this series:
National Climate Assessment
Keywords:
SVS >> Earth
SVS >> HDTV
NASA Science >> Earth


