SIGGRAPH 2014
Overview
ACM/SIGGRAPH is the Association for Computing Machinery’s Special Interest Group on GRAPHics. This international event is widely recognized as the most prestigious forum for computer graphics research. Collaborators from academia to the special effects industry gather to educate and exchange their latest techniques and technologies.
The SVS gave several presentations at SIGGRAPH 2014 including:
— a “Studio Talk" on the 45th Anniversary of the Apollo 8 Earth-rise
— a “Dailies” presentation on elevation changes in Greenland’s ice sheet
— a “Dallies” presentation on the Global Precipitation Mission’s first light images
— a “Dailies” presentation on global volume rendered clouds.
Visuals
- ID: 4129 Visualization
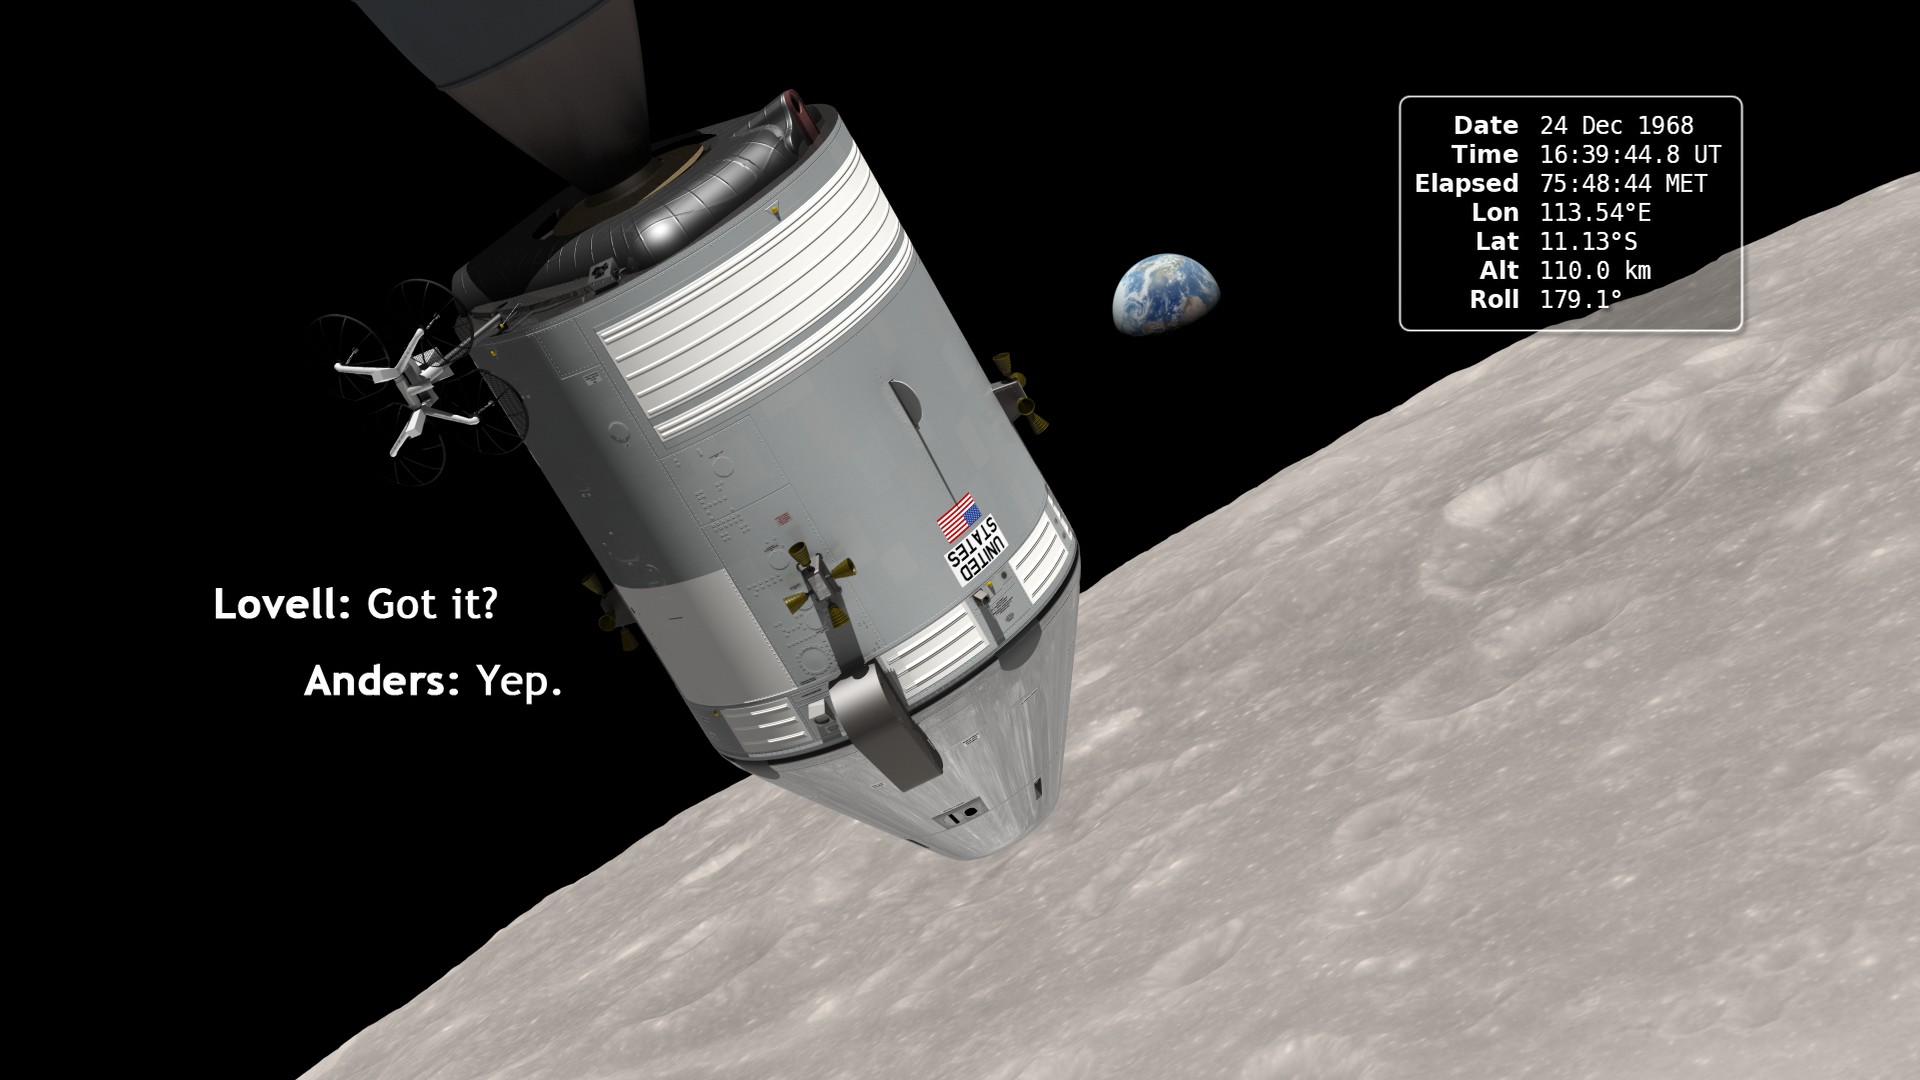
Earthrise: The 45th Anniversary
Go to this pageIn December of 1968, the crew of Apollo 8 became the first people to leave our home planet and travel to another body in space. But as crew members Frank Borman, James Lovell, and William Anders all later recalled, the most important thing they discovered was Earth.Using photo mosaics and elevation data from Lunar Reconnaissance Orbiter (LRO), this video commemorates the 45th anniversary of Apollo 8's historic flight by recreating the moment when the crew first saw and photographed the Earth rising from behind the Moon. Narrator Andrew Chaikin, author of A Man on the Moon, sets the scene for a three-minute visualization of the view from both inside and outside the spacecraft accompanied by the onboard audio of the astronauts.The visualization draws on numerous historical sources, including the actual cloud pattern on Earth from the ESSA-7 satellite and dozens of photographs taken by Apollo 8, and it reveals new, historically significant information about the Earthrise photographs. It has not been widely known, for example, that the spacecraft was rolling when the photos were taken, and that it was this roll that brought the Earth into view. The visualization establishes the precise timing of the roll and, for the first time ever, identifies which window each photograph was taken from.The key to the new work is a set of vertical stereo photographs taken by a camera mounted in the Command Module's rendezvous window and pointing straight down onto the lunar surface. It automatically photographed the surface every 20 seconds. By registering each photograph to a model of the terrain based on LRO data, the orientation of the spacecraft can be precisely determined.Andrew Chaikin's article Who Took the Legendary Earthrise Photo From Apollo 8? appeared in the January, 2018 issue of Smithsonian magazine. It includes the story of the making of this visualization.A Google Hangout discussion of this visualization between Ernie Wright (creator of the visualization), Andrew Chaikin, John Keller (LRO project scientist), and Aries Keck (NASA media specialist) was held on December 20, 2013. A replay of that hangout is available here.Ernie Wright presented a talk about the making of this animation at the 2014 SIGGRAPH Conference in Vancouver. He also wrote a NASA Wavelength blog entry about Earthrise that includes links to educator resources related to LRO. ||
- ID: 4194 Visualization
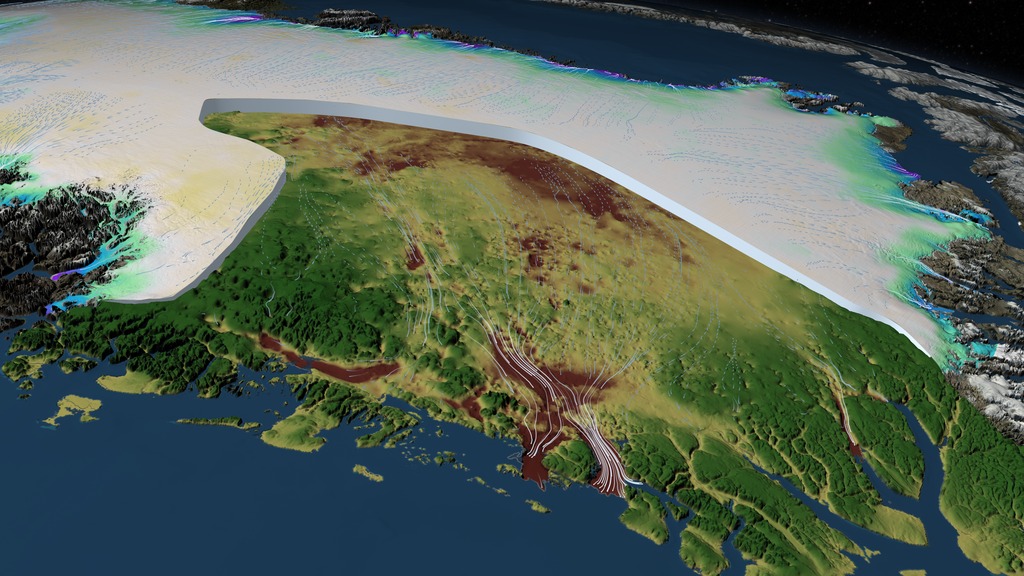
SIGGRAPH Daily 2014: Measuring Elevation Changes on the Greenland Ice Sheet
Go to this pageThis animation depicts the changes in the Greenland Ice Sheet between 2003 and 2012 and shows how the bedrock topography under the ice constrains or facilitates its movement. This is a subset of a longer, narrated animation that can be found here.The surface elevation1 and the bedrock topography2 are defined by geo-referenced DEM datasets. The change in elevation data3 derived from data collected by NASA’s ICESat satellite and from an airborne mission called Operation IceBridge is portrayed as colors accumulating over time on the surface. A cutting plane is used to reveal the thickness of the ice sheet and the bedrock topography beneath. A dataset of ice sheet velocity4 derived from from satellite interferometry is used to define the motion of the ice sheet over time. Ice flow movement is calculated from this velocity data, colored by the speed of the ice, and propagated over the surface of the ice sheet.This visualization was generated using Maya, Renderman and IDL. Over the years, we developed some tools to facilitate visualizing data. These include manifolds that accurately project data onto a sphere, routines to accurately access the correct data texture in a series based on the date keyframed in a Maya scene and a flow system that propagates flow vectors at any given time step and inserts the results directly into the RIB stream at render time. These tools are a credit to the director of our studio, Dr. Horace Mitchell and my colleague Greg Shirah.1. Greenland Mapping Project (GIMP) Digital Elevation Model provided courtesy of the BPRC Glacier Dynamics Research Group, Ohio State University2. Greenland bed elevation provided courtesy of J. L. Bamber, Univesity of Bristol.3. Elevation Change data provided courtesy of Bea Csatho, University at Buffalo.4. Ice Sheet Velocity data provided courtesy of Eric Rignot, University of California, Irvine. ||
- ID: 4153 Visualization
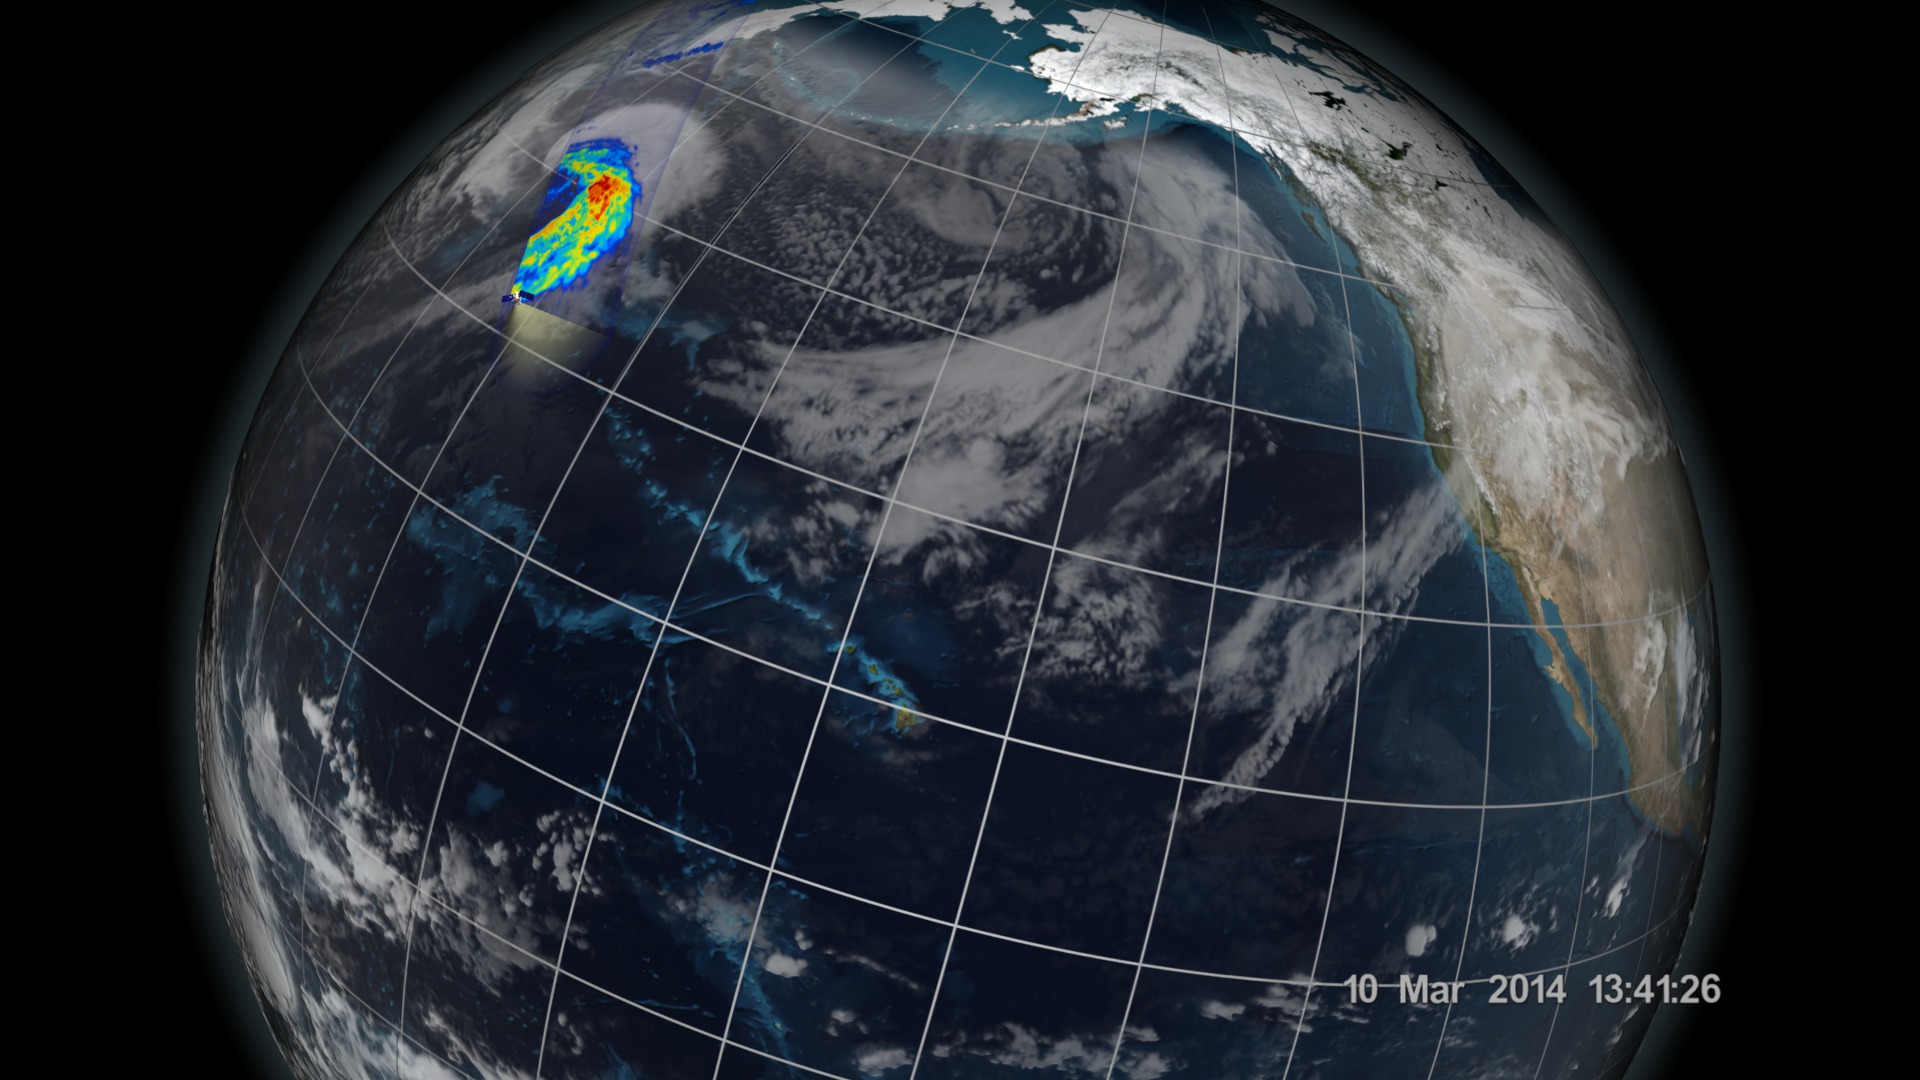
GPM/GMI First Light
Go to this pageEleven days after the Feb. 27 launch of the Global Precipitation Measurement (GPM) Core Observatory, the two instruments aboard took their first joint images of an interesting precipitation event. On March 10, the Core Observatory passed over an extra-tropical cyclone about 1055 miles (1700 kilometers) due east of Japan's Honshu Island. The storm formed from the collision of a cold front wrapping around a warm front, emerging over the ocean near Okinawa on March 8. It moved northeast over the ocean south of Japan, drawing cold air west-to-east over the land, a typical winter weather pattern that also brought heavy snow over Hokkaido, the northernmost of the four main islands. After the GPM images were taken, the storm continued to move eastward, slowly intensifying before weakening in the central North Pacific.This visualization shows data from the GPM Microwave Imager, which observes different types of precipitation with 13 channels. Scientists analyze that data and then use it to calculate the light to heavy rain rates and falling snow within the storm.For more information on this topic: GPM web siteOther multimedia items related to this story: GPM GMI First Light (#11508) GPM DPR First Light (#11509) ||
- ID: 4180 Visualization
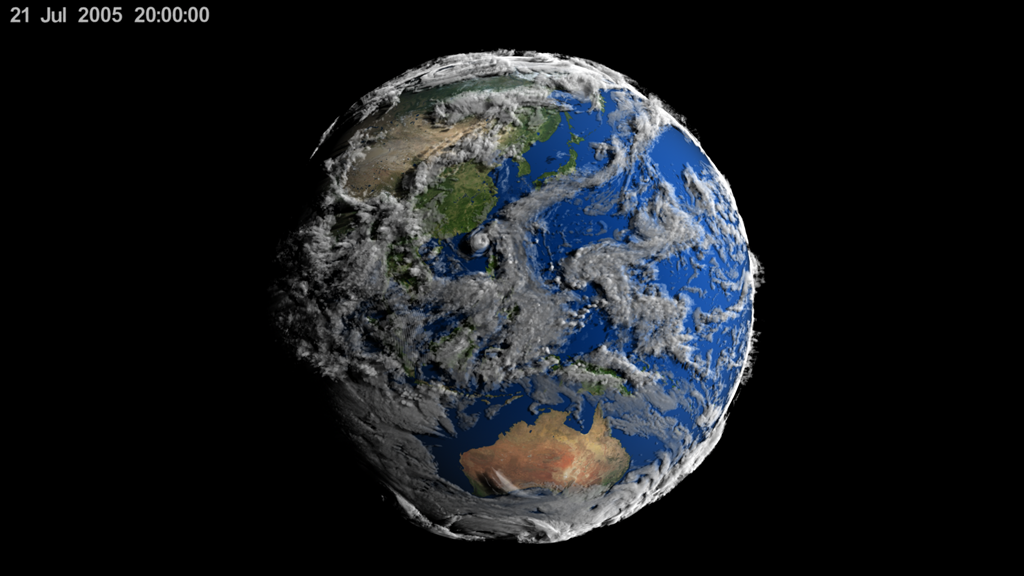
Volume-Rendered Global Atmospheric Model
Go to this pageThis visualization shows early test renderings of a global computational model of Earth's atmosphere based on data from NASA's Goddard Earth Observing System Model, Version 5 (GEOS-5). This particular run, called 7km GEOS-5 Nature Run (7km-G5NR), was run on a supercomputer, spanned 2 years of simulation time at 30 minute intervals, and produced petabytes of output. The model uses a 7.5 km cube-sphere parameterization. Geographic coordinate output volumes from the model are 5760 x 2881 x 72 voxels per time step. For each voxel numerous physical parameters are available such as temperature, wind speed and direction, pressure, humidity, etc. This visualziation uses a combination of the CLOUD and TAUIR parameters.The visualization spans a little more than 7 days of simulation time which is 354 time steps. The time period was chosen because a simulated category-4 typhoon developed off the coast of China. The frames were rendered using Renderman. Brickmap volumes generated for each time step are about 2.6 gigabytes. This short visualization referenced nearly a terabyte of brickmap files. The 7 day period is repeated several times during the course of the visualization.This visualization was presented at SIGGRAPH 2014 during the Dailies session. ||