The Galleries
Earth Science Galleries
- ID: 40467
 Gallery
 - ID: 40415
 Gallery
 - ID: 40016
 Gallery
 - ID: 40388
 Gallery
 - ID: 40484
 Gallery
 - ID: 40420
 Gallery
 - ID: 40272
 Gallery
 - ID: 40391
 Gallery
 - ID: 40249
 Gallery
 - ID: 40176
 Gallery
 - ID: 40170
 Gallery
 - ID: 40028
 Gallery
 - ID: 40044
 Gallery
 - ID: 40348
 Gallery
 - ID: 40447
 Gallery
 - ID: 40124
 Gallery
Heliophysics Galleries
- ID: 40046 Gallery
NASA's Heliophysics Gallery
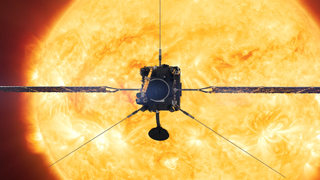
Go to this pageThe Sun is a major influence on Earth's weather and climate. The focus of NASA's Sun-Solar System Connection is to understand this relationship from the perspective of the entire system. You can find out more by visiting the Heliophysics Page, the NASA Living with a Star program, and the Solar-Terrestrial Probe web site.
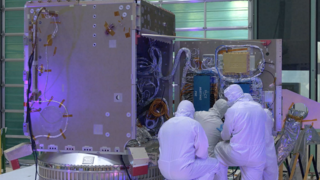
- ID: 40520 Gallery
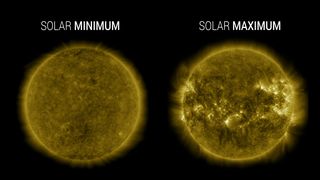
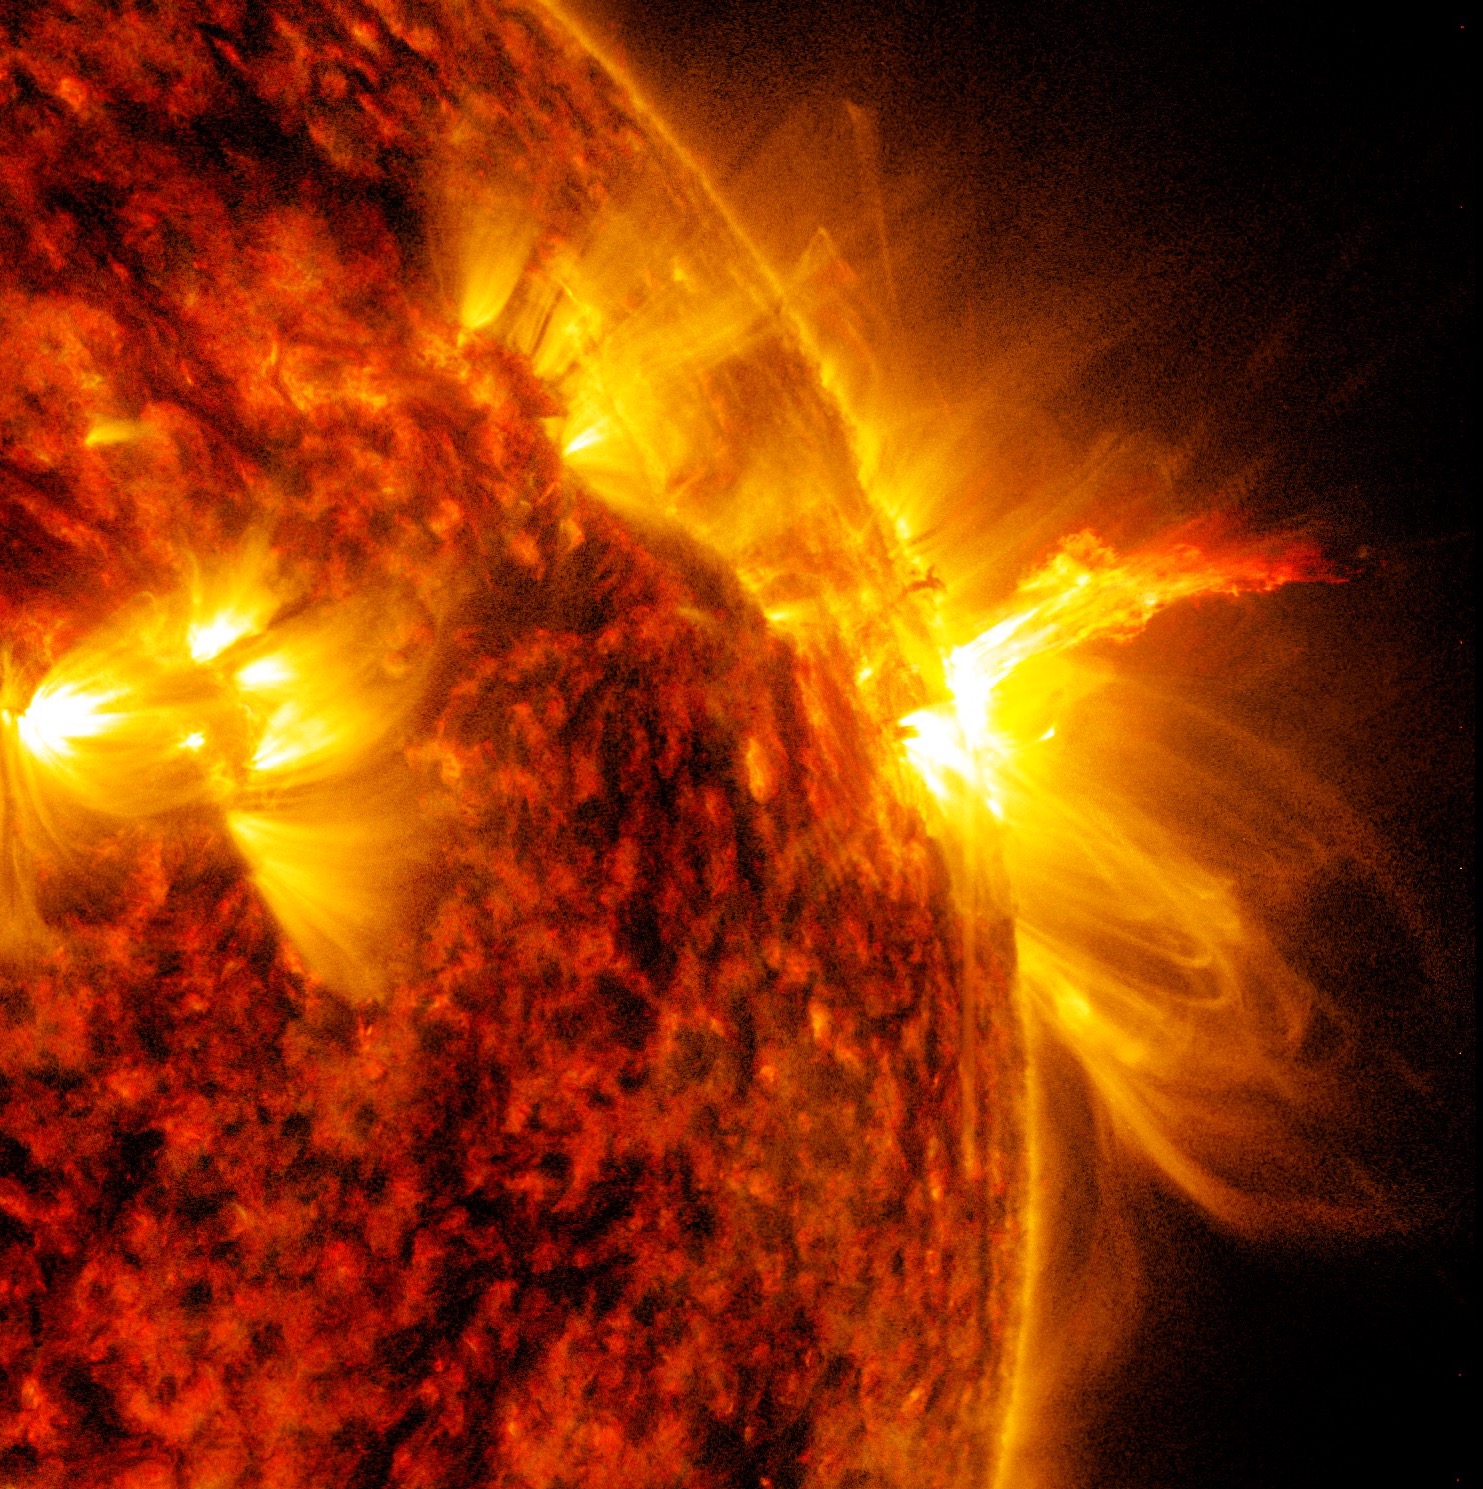
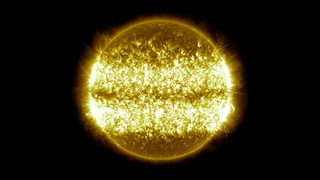
Solar Cycle 25
Go to this pageThe Solar Cycle 25 Prediction Panel, an international group of experts co-sponsored by NASA and the National Oceanic and Atmospheric Administration (NOAA), announced that solar minimum occurred in December 2019, marking the start of Solar Cycle 25. Since then, the Sun’s activity has been steadily increasing as it approaches solar maximum — the peak of Solar Cycle 25.A new solar cycle comes roughly every 11 years. Over the course of each cycle, the Sun transitions from relatively calm to active and stormy, and then quiet again. At its peak, the Sun’s magnetic poles flip.Understanding the Sun’s behavior is an important part of life in our solar system. The Sun’s outbursts, including eruptions known as solar flares and coronal mass ejections, can disturb satellites and communication signals traveling around Earth. Scientists study the solar cycle so we can better understand and predict solar activity.
- ID: 40502 Gallery
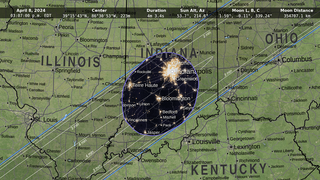
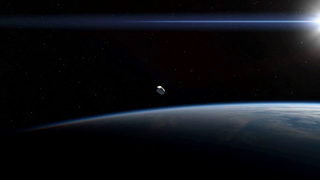
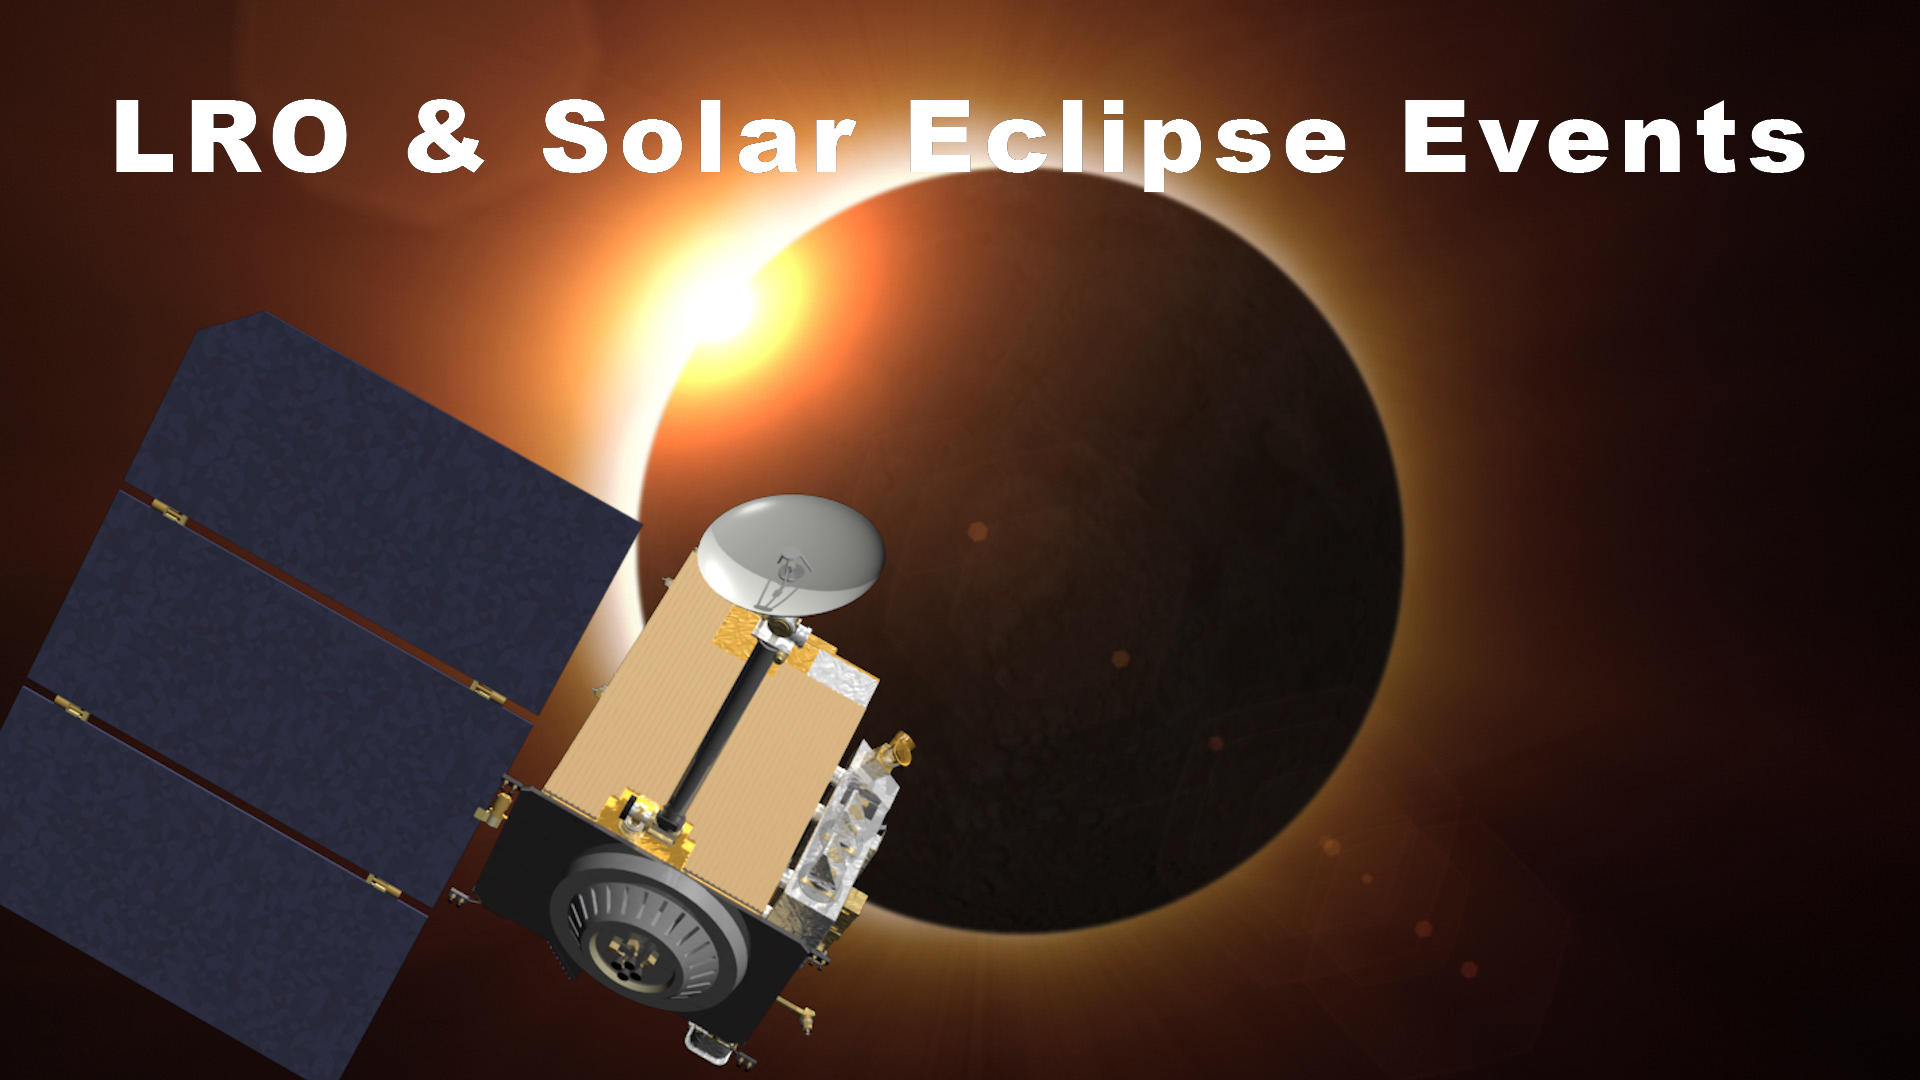
2024 Total Solar Eclipse
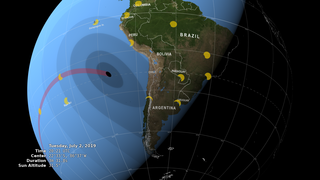
Go to this pageOn April 8, 2024, a total solar eclipse will cross North America, passing over Mexico, the United States, and Canada. A total solar eclipse happens when the Moon passes between the Sun and Earth, completely blocking the face of the Sun. The sky will darken as if it were dawn or dusk.A total solar eclipse happens when the Moon passes between the Sun and Earth, completely blocking the face of the Sun. People viewing the eclipse from locations where the Moon’s shadow completely covers the Sun – known as the path of totality – will experience a total solar eclipse. The sky will darken, as if it were dawn or dusk. Weather permitting, people along the path of totality will see the Sun’s corona, or outer atmosphere, which is usually obscured by the bright face of the Sun.Learn more about this total solar eclipse: solarsystem.nasa.gov/eclipses/2024
- ID: 40500 Gallery
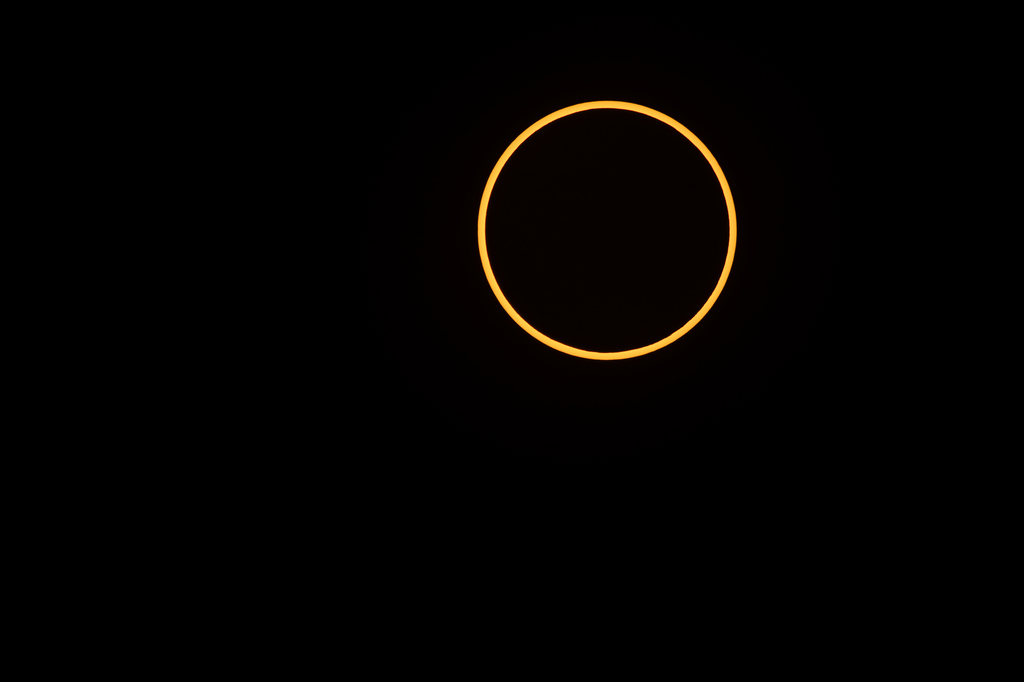
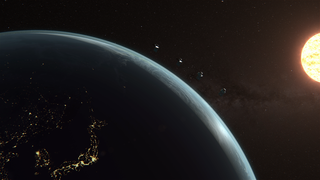
2023 Annular Solar Eclipse
Go to this pageOn Oct. 14, 2023, an annular solar eclipse will cross North, Central, and South America. Visible in parts of the United States, Mexico, and many countries in South and Central America, millions of people in the Western Hemisphere can experience this eclipse. An annular solar eclipse happens when the Moon passes between the Sun and Earth while it is at or near its farthest point from Earth. Because the Moon is farther away from Earth than usual, it appears smaller than the Sun and does not completely cover the star. Because of this, the Sun will appear like a “ring of fire” in the sky for those in the path of annularity. During an annular eclipse, it is never safe to look directly at the Sun without specialized eye protection designed for solar viewing. Learn more about this annular solar eclipse: solarsystem.nasa.gov/eclipses/2023
- ID: 40117 Gallery
Heliophysics Breaking News
Go to this pageThis gallery contains an archive of breaking news solar events such as flares, CMEs, solar storms, and comet passes. The most recent material is at the top left, and it progresses back in time left-to-right and top-down. Each page contains video and/or stills of a distinct event or series of linked events.The videos are available at multiple resolutions and compressions, including Apple ProRes 422. Where applicable, there are links to 4k x 4k tif frames.For sun-related background, animations, visualizations and informational content, go here.For pre-recorded, frequently-asked-question interviews with NASA scientists, go here.
- ID: 40115 Gallery
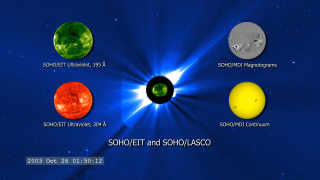
Space Weather
Go to this pageThe term "space weather" was coined not long ago to describe the dynamic conditions in the Earth's outer space environment, in the same way that "weather" and "climate" refer to conditions in Earth's lower atmosphere. Space weather includes any and all conditions and events on the sun, in the solar wind, in near-Earth space and in our upper atmosphere that can affect space-borne and ground-based technological systems and through these, human life and endeavor. Heliophysics is the science of space weather. This gallery organizes satellite footage, animations, visualizations, and edited videos produced at the Goddard Space Flight Center. Visualizations are different from pure animations because they are data-driven. They present a way of "seeing" the data. In the case of orbit visualizations, they are based on actual orbit information. Most of the animations and visualizations are available as frames and all the recent ones are HD quality. All videos are available in several formats and qualities including Apple ProRes for broadcast quality. Unless specifically marked otherwise, all these materials are public domain and free to use. For more infomation about NASA's media use guidelines see this page. The content is organized in two ways. Under "Facets of Space Weather" you will find our visuals grouped by the subject they address. Under "NASA Spacecraft" you will find our visuals grouped by the satellite they were collected by, or that they refer to. This group also contains animations of the spacecraft themselves.
For breaking news solar events, go to this gallery.For frequently-asked-question interviews with NASA scientists, go here.
Planetary Science Galleries
- ID: 40122 Gallery
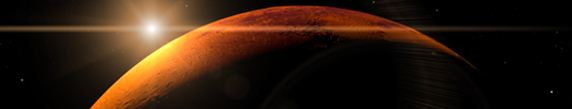
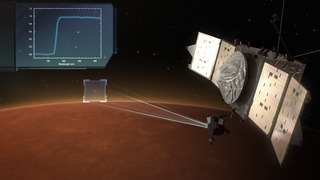
Mars Missions and Science
Go to this pageThis multimedia gallery assembles and organizes Mars content on the Scientific Visualization Studio website. Highlights of NASA Goddard Space Flight Center’s animations, visualizations, videos, images and graphics relating to Mars science and missions can be found here.
- ID: 40343 Gallery

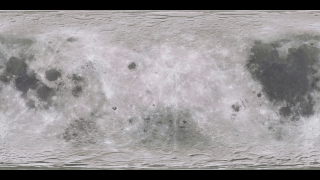
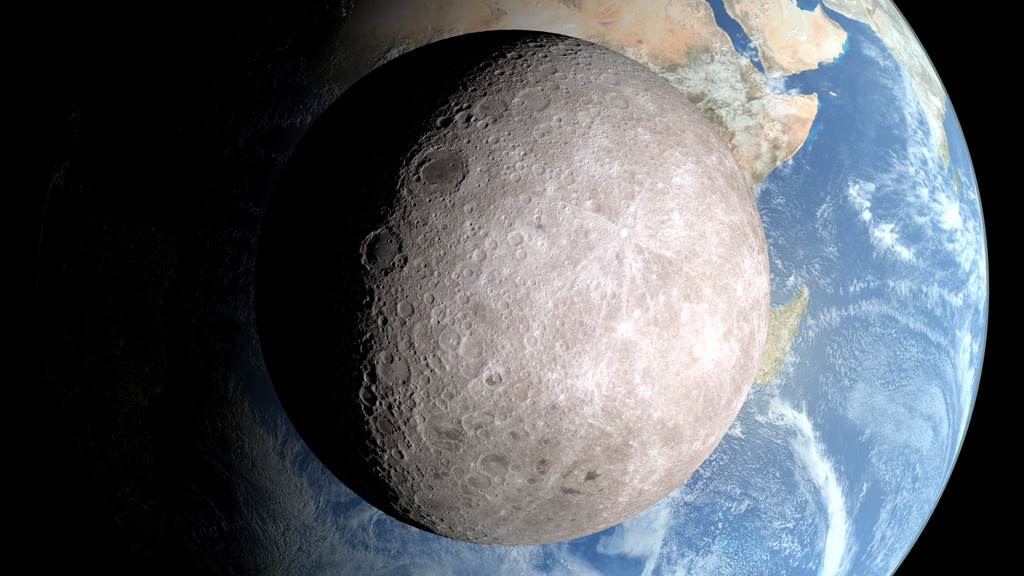
Moon Phase and Libration
Go to this pageCurrent Moonshow_moon_image(); show_moon_info();
Every year since 2011, the SVS produces its annual visualization of the Moon's phase and libration comprising 8760 hourly renderings of the precise size, orientation, and illumination of our nearest neighbor in space. The above displays the current state of the Moon. Click on the image to download a much larger version with labeled craters and additional graphics. Follow the links below to see the Moon at any hour of the year, play the animations, access the frames at multiple resolutions, and read detailed explanations. - ID: 40371 Gallery
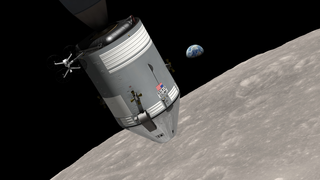
Project Apollo
Go to this pageThis is a collection of the media resources available on the Scientific Visualization Studio website relating to NASA's Apollo missions to the Moon. More information and media can be found at NASA.gov
Apollo Lunar Surface Journal
Apollo Flight Journal
Apollo Landing Sites photographed by Lunar Reconnaissance Orbiter
Apollo in Real TimeProject Apollo Archive on Flickr - ID: 40439 Gallery
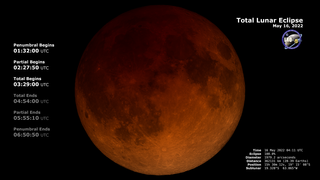
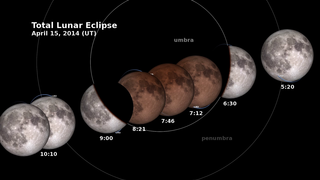
Lunar Eclipse
Go to this pageThis gallery contains videos and visualizations related to Lunar Eclipses
Astrophysics Galleries
- ID: 40073 Gallery
Goddard's Astrophysics Gallery
Go to this pageThis multimedia gallery assembles and organizes the astrophysics content on the Scientific Visualization Studio website. All of NASA's Goddard Space Flight Center's animations, visualizations, videos and still images relating to the universe beyond our Solar System are here. Browse through the basic categories or find Goddard's most recent releases under each specific astronomical feature. Find all the content relating to a particular satellite under "Missions." Most entries have multiple downloadable formats and several resolutions.
- ID: 40436 Gallery
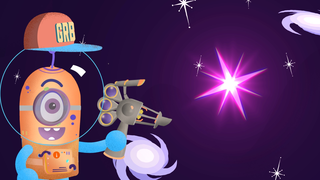
Black Hole Week
Go to this pageThis gallery brings together resources related to NASA’s Black Hole Week — videos, social media products, news stories, still images, and assets. This week is a celebration of celestial objects with gravity so intense that even light cannot escape them. Our goal is that no matter where people turn that week they will run into a black hole. (Figuratively, of course — we don’t want anyone falling in!)
- ID: 40368 Gallery
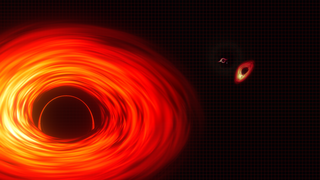
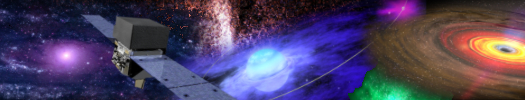
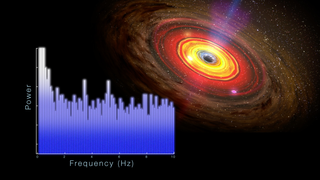
Black Holes
Go to this pageThis gallery gathers together visualizations and narrated videos about black holes. A black hole is a celestial object whose gravity is so intense that even light cannot escape it. Astronomers observe two main types of black holes. Stellar-mass black holes contain three to dozens of times the mass of our Sun. They form when the cores of very massive stars run out of fuel and collapse under their own weight, compressing large amounts of matter into a tiny space. Supermassive black holes, with masses up to billions of times the Sun’s, can be found at the centers of most big galaxies. Although a black hole does not emit light, matter falling toward it collects in a hot, glowing accretion disk that astronomers can detect.
- ID: 40466 Gallery
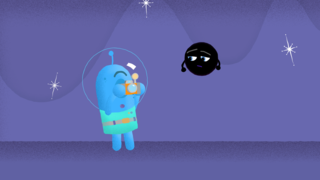
The Traveler
Go to this pageOur Traveler can’t wait to explore the universe! It’s hard not to be caught up in their boundless enthusiasm for all the wondrous sights the cosmos has to offer. This gallery brings together resources related to the intrepid blue Traveler and their adventures. This includes videos, videos, social media products, still images, and assets.
Missions and Instrument Galleries
- ID: 40305
- ID: 40116
 Gallery
 - ID: 40262
 Gallery
 - ID: 40333
 Gallery
 - ID: 40513
- ID: 40083
 Gallery
 - ID: 40435
 Gallery
 - ID: 40523
 Gallery
 - ID: 40134
 Gallery
 - ID: 40077
 Gallery
 - ID: 40247
 Gallery
 - ID: 40345
![Complete transcript available.Music credits: 'Faint Glimmer' by Andrew John Skeet [PRS], Andrew Michael Britton [PRS], David Stephen Goldsmith [PRS], 'Ocean Spirals' by Andrew John Skeet [PRS], Andrew Michael Britton [PRS], David Stephen Goldsmith [PRS] from Killer Tracks.Watch this video on the NASA Goddard YouTube channel.](/vis/a010000/a012800/a012817/GOLDOverview_YouTube.00001_searchweb.png) Gallery
Gallery - ID: 40118
 Gallery
 - ID: 40525
 Gallery
 - ID: 40179
 Gallery
 - ID: 40346
 Gallery
 - ID: 40098
 Gallery
 - ID: 40423
 Gallery
 - ID: 40063
 Gallery
 - ID: 40152
 Gallery
 - ID: 40217
 Gallery
 - ID: 40320
 Gallery
 - ID: 40378
 Gallery
 - ID: 40161
 Gallery
 - ID: 40446
 Gallery
 - ID: 40338
 Gallery
 - ID: 40532
 Gallery
 - ID: 40349
 Gallery
 - ID: 40455
 Gallery
 - ID: 40355
 Gallery
 - ID: 40495
 Gallery
 - ID: 40064
 Gallery
 - ID: 40400
 Gallery
 - ID: 40354
 Gallery
 - ID: 40325
 Gallery
 - ID: 40535
 Gallery
 - ID: 40456
 Gallery
Special Productions
- ID: 40534
 Gallery
 - ID: 40533
 Gallery
 - ID: 40516Gallery
- ID: 40431
 Gallery
 - ID: 40065
 Gallery
 - ID: 40066
 Gallery
 - ID: 40067
 Gallery
 - ID: 40068
 Gallery
 - ID: 40162
 Gallery
 - ID: 40447Gallery
- ID: 40433
 Gallery
 - ID: 40271
 Gallery
Special Events
- ID: 40521
 Gallery
 - ID: 40490
 Gallery
 - ID: 40440
 Gallery
 - ID: 40429
 Gallery
 - ID: 40419
 Gallery
 - ID: 40458
 Gallery
 - ID: 40439Gallery
- ID: 40436Gallery
- ID: 40204
 Gallery
 - ID: 40158
 Gallery
 - ID: 40374
 Gallery
 - ID: 40367
 Gallery
 - ID: 40365
- ID: 40337
 Gallery
 - ID: 40227
 Gallery
 - ID: 40316
 Gallery
 - ID: 40301
 Gallery
 - ID: 40239
- ID: 40281
 Gallery
 - ID: 40273
 Gallery
 - ID: 40260
- ID: 40228
- ID: 40248
- ID: 40222
- ID: 40180
 Gallery
 - ID: 40168
 Gallery
 - ID: 40163
 Gallery
 - ID: 40079
 Gallery
 - ID: 40072
- ID: 40005
 Gallery
 - ID: 40087
- ID: 40219
- ID: 40269
 Gallery
 - ID: 40099
 Gallery
Hyperwall
- ID: 40518 Gallery
Hyperwall Power Playlist - Astrophysics Focus
Go to this pageThis is a collection of our most powerful, newsworthy, and frequently used Hyperwall-ready visualizations, along with several that haven't gotten the attention they deserve. They're especially great for more general or top-level science talks, or to "set the scene" before a deep dive into a more focused subject or dataset. We've tried to cover the subject areas our speakers focus on most. If you're not seeing what you're looking for, there is a huge library of visualizations more localized or specialized in subject - please use the Search function above, and filter "Result type" for "Hyperwall Visual." If you'd like to use one of these visualizations in your Hyperwall presentation, we'll need to know which element on which page. On the visualization's web page, below the visual you'd like to use, you'll see a Link icon next to the Download button. All we need is for you to click on that icon and include that link in your presentation Powerpoint/Keynote or visualization list. Additionally, please check our Hyperwall How-To Guide for tips on designing your Hyperwall presentation, file specifications, and Powerpoint/Keynote templates.
- ID: 40505 Gallery
Hyperwall Power Playlist - Planetary Science Focus
Go to this pageThis is a collection of our most powerful, newsworthy, and frequently used Hyperwall-ready visualizations, along with several that haven't gotten the attention they deserve. They're especially great for more general or top-level science talks, or to "set the scene" before a deep dive into a more focused subject or dataset. We've tried to cover the subject areas our speakers focus on most. If you're not seeing what you're looking for, there is a huge library of visualizations more localized or specialized in subject - please use the Search function above, and filter "Result type" for "Hyperwall Visual." If you'd like to use one of these visualizations in your Hyperwall presentation, we'll need to know which element on which page. On the visualization's web page, below the visual you'd like to use, you'll see a Link icon next to the Download button. All we need is for you to click on that icon and include that link in your presentation Powerpoint/Keynote or visualization list. Additionally, please check our Hyperwall How-To Guide for tips on designing your Hyperwall presentation, file specifications, and Powerpoint/Keynote templates.
- ID: 40507 Gallery
Hyperwall Power Playlist - Heliophysics Focus
Go to this pageThis is a collection of our most powerful, newsworthy, and frequently used Hyperwall-ready visualizations, along with several that haven't gotten the attention they deserve. They're especially great for more general or top-level science talks, or to "set the scene" before a deep dive into a more focused subject or dataset. We've tried to cover the subject areas our speakers focus on most. If you're not seeing what you're looking for, there is a huge library of visualizations more localized or specialized in subject - please use the Search function above, and filter "Result type" for "Hyperwall Visual." If you'd like to use one of these visualizations in your Hyperwall presentation, we'll need to know which element on which page. On the visualization's web page, below the visual you'd like to use, you'll see a Link icon next to the Download button. All we need is for you to click on that icon and include that link in your presentation Powerpoint/Keynote or visualization list. Additionally, please check our Hyperwall How-To Guide for tips on designing your Hyperwall presentation, file specifications, and Powerpoint/Keynote templates.
- ID: 40503 Gallery
Hyperwall Power Playlist - Earth Science Focus
Go to this pageThis is a collection of our most powerful, newsworthy, and frequently used Hyperwall-ready visualizations, along with several that haven't gotten the attention they deserve. They're especially great for more general or top-level science talks, or to "set the scene" before a deep dive into a more focused subject or dataset. We've tried to cover the subject areas our speakers focus on most. If you're not seeing what you're looking for, there is a huge library of visualizations more localized or specialized in subject - please use the Search function above, and filter "Result type" for "Hyperwall Visual." If you'd like to use one of these visualizations in your Hyperwall presentation, we'll need to know which element on which page. On the visualization's web page, below the visual you'd like to use, you'll see a Link icon next to the Download button. All we need is for you to click on that icon and include that link in your presentation Powerpoint/Keynote or visualization list. Additionally, please check our Hyperwall How-To Guide for tips on designing your Hyperwall presentation, file specifications, and Powerpoint/Keynote templates.
- ID: 40414 Gallery
- ID: 40410 Gallery
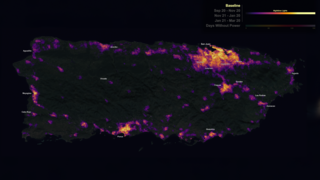
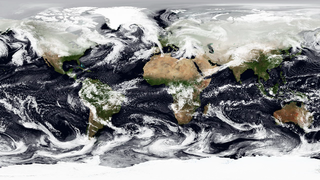
Earth at Night Imagery
Go to this pageDazzling photographs and images from space of our planet’s nightlights have captivated public attention for decades. In such images, patterns are immediately seen based on the presence or absence of light: a distinct coastline, bodies of water recognizable by their dark silhouettes, and the faint tendrils of roads and highways emanating from the brilliant blobs of light that are our modern, well-lit cities. For nearly 25 years, satellite images of Earth at night have served as a fundamental research tool, while also stoking public curiosity. These images paint an expansive and revealing picture, showing how natural phenomena light up the darkness and how humans have illuminated and shaped the planet in profound ways since the invention of the light bulb 140 years ago.
- ID: 40046 Gallery
NASA's Heliophysics Gallery
Go to this pageThe Sun is a major influence on Earth's weather and climate. The focus of NASA's Sun-Solar System Connection is to understand this relationship from the perspective of the entire system. You can find out more by visiting the Heliophysics Page, the NASA Living with a Star program, and the Solar-Terrestrial Probe web site.
Educational Content
- ID: 40447 Gallery
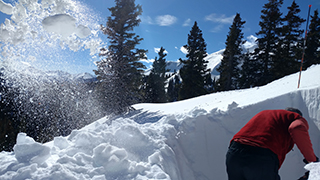
Visualizations for Educators
Go to this pagePhenomena are observable events that occur in nature. Data visualizations can offer new ways for students to experience and explore Earth and space phenomena that happen over large scales of time and at great distances. This gallery includes visualizations of phenomena that support topics that are taught in middle and high school and are aligned with select Next Generation Science Standards. This gallery was curated by Anne Arundle County Science Teachers Margaret Graham and Jeremy Milligan with support from Dr. Rachel Connolly during the summer of 2022. A video showing how Jeremy Milligan uses SVS resources to develop a phenomena-based lesson is also available.