Cryosphere Video Files
Overview
This page contains resource reels or Video Files about arctic sea ice, land ice and glaciers. Related missions include ICESat, ICESat-II, Operation IceBridge, among others. The Video Files are listed with the most current at the top of the page.
Operation IceBridge 2011: Greenland
- ID: 10750 Produced Video

Operation IceBridge Arctic 2011 resource reel
Go to this pageOIB_Arctic_2011_broll_youtube_hq.00452_print.jpg (1024x576) [83.4 KB] || OIB_Arctic_2011_broll_youtube_hq_web.png (320x180) [253.7 KB] || OIB_Arctic_2011_broll_youtube_hq_thm.png (80x40) [15.9 KB] || OIB_Arctic_2011_broll_youtube_hq.mov (1280x720) [143.5 MB] || OIB_Arctic_2011_broll_prores.mov (1280x720) [3.8 GB] || OIB_Arctic_2011_broll_youtube_hq.webmhd.webm (960x540) [68.2 MB] ||
Operation IceBridge Fall 2010: Antarctic
- ID: 10692 Produced Video
IceBridge Antarctic 2010 Video File
Go to this pageOperation IceBridge video file for the Antarctic 2010 campaign. ||
Petermann Glacier Video File
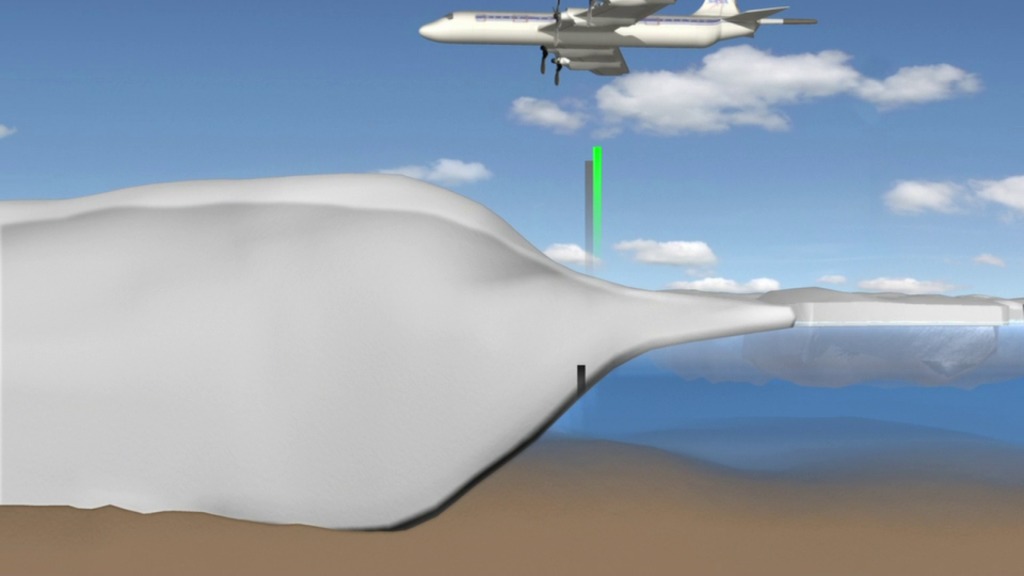
On August 5, 2010, an enormous chunk of ice, roughly 97 square miles in size, broke off the Petermann Glacier, along the northwestern coast of Greenland. The glacier lost about one-quarter of its 40-mile long floating ice shelf, the Northern Hemisphere's largest. It's not unusual for large icebergs to calve off the Petermann Glacier, but this new one is the largest to form in the Arctic since 1962.
- ID: 10627 Produced Video
Video File: Large Slab of Greenland's Petermann Glacier Breaks Off
Go to this pageOn August 5, 2010, an enormous chunk of ice, roughly 97 square miles in size, broke off the Petermann Glacier, along the northwestern coast of Greenland. The glacier lost about one-quarter of its 40-mile long floating ice shelf, the Northern Hemisphere's largest. It's not unusual for large icebergs to calve off the Petermann Glacier, but this new one is the largest to form in the Arctic since 1962. ||
 Link
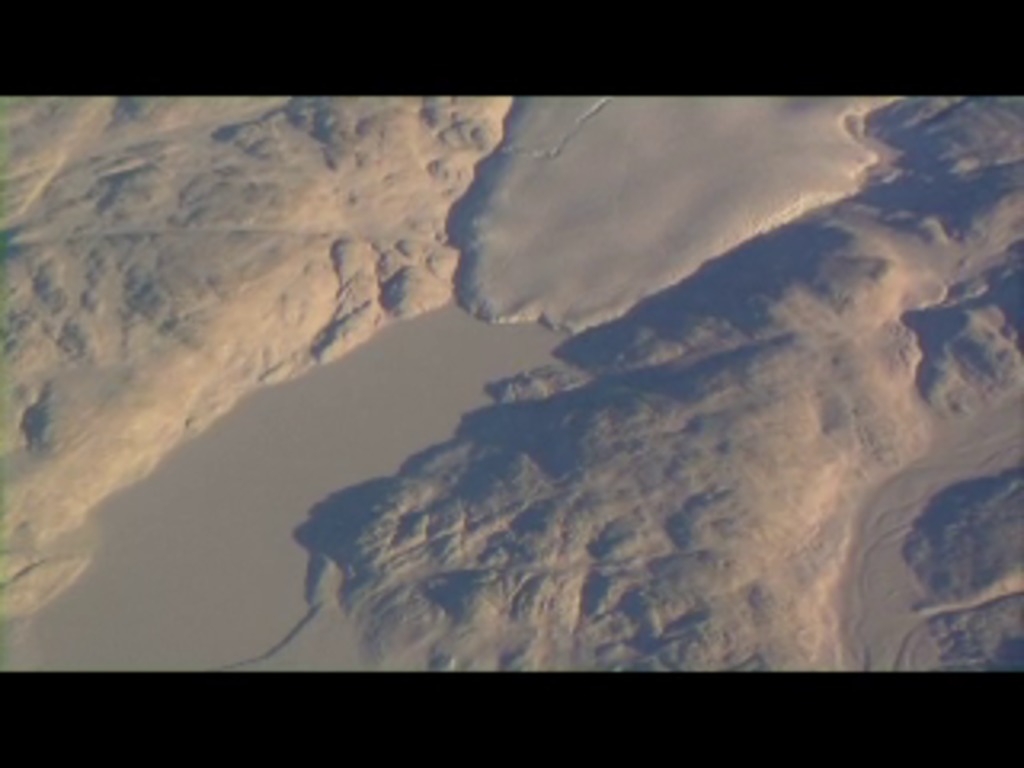
LinkMODIS Imagery Provides a Before and After View of Petermann
The Earth Observatory published high resolution images of Petermann Glacier before and after it lost roughly 97 square miles of area on August 5, 2010.
Go to this link- ID: 10518 Produced Video
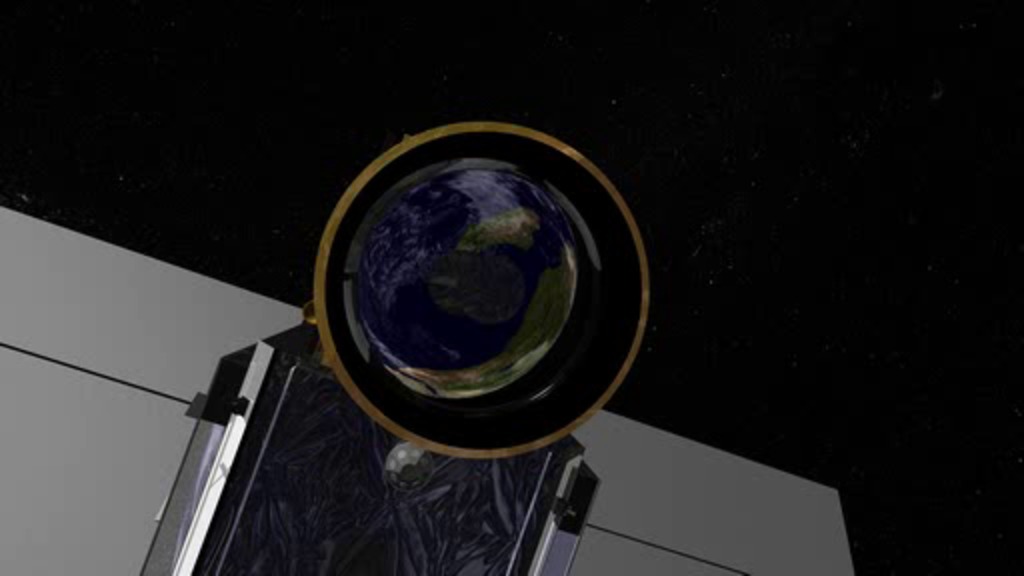
ICESat Spacecraft
Go to this pageAnimations of the ICESat spacecraft on orbit || ICESat's collector viewed with Earth reflecting in its lens || icec000100002_print.jpg (1024x576) [47.9 KB] || icec0001_web.png (320x180) [266.4 KB] || icec0001_thm.png (80x40) [15.5 KB] || Collector_1080i.webmhd.webm (960x540) [2.1 MB] || collector (1920x1080) [32.0 KB] || Collector_1080i.m2v (1920x1080) [47.2 MB] || Collector.mp4 (1920x1080) [7.1 MB] || Collector_512x288.m1v (512x288) [3.2 MB] ||
- ID: 3467 Visualization
Updated Jakobshavn Glacier Calving Front Retreat from 2001 through 2006 with Blue/White Elevation Change over Greenland
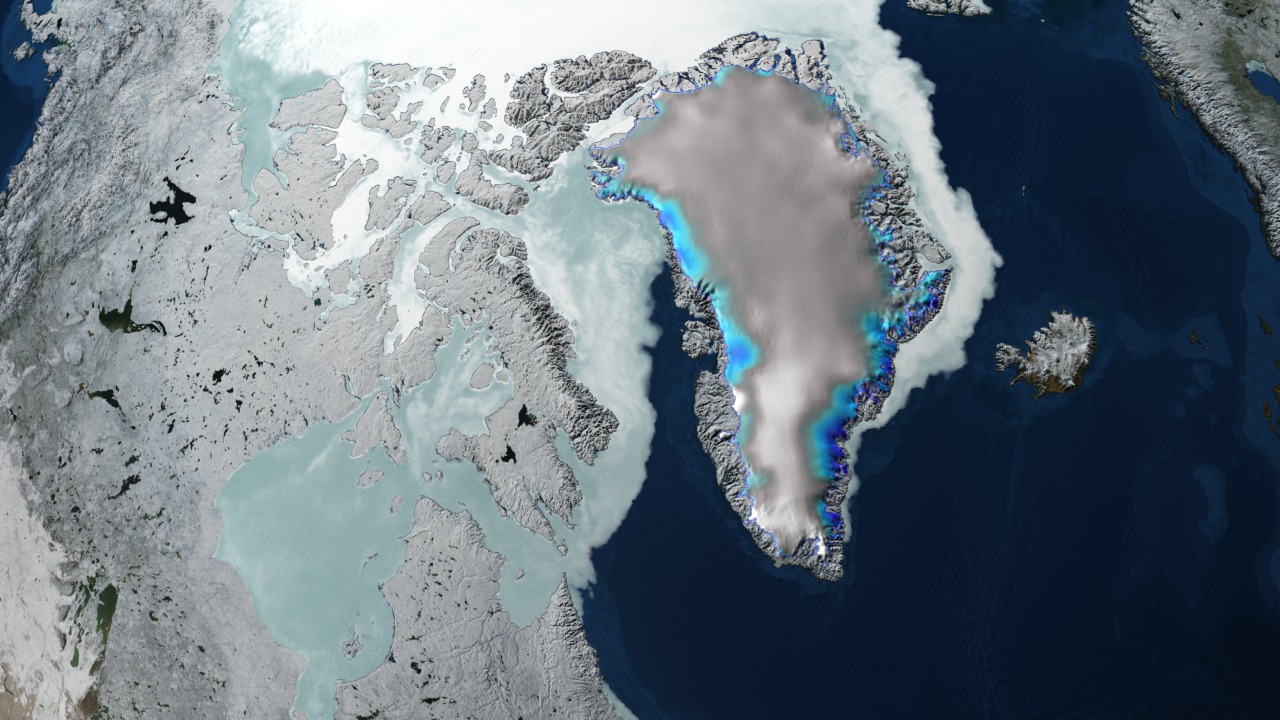
Go to this pageSince measurements of Jakobshavn Isbrae were first taken in 1850, the glacier gradually receded until about 1950, where it remained stable for the past 5 decades. However, from 1997 to 2006, the glacier has begun to recede again, this time almost doubling in speed. The finding is important for many reasons. As more ice moves from glaciers on land into the ocean, ocean sea levels raise. Jakobshavn Isbrae is Greenland's largest outlet glacier, draining 6.5 percent of Greenland's ice sheet area. The ice stream's speed-up and near-doubling of ice flow from land into the ocean has increased the rate of sea level rise by about .06 millimeters (about .002 inches) per year, or roughly 4 percent of the 20th century rate of sea level increase. This animation shows the glacier's flow in 2000, along with changes in the glacier's calving front between 2001 and 2006.This animation is an update of, and extension to, animation IDs #3374 and #3434.In this version, the pause on the approach to the Jakobshavn glacier where the meltwater lakes on the Greenland ice sheet are visible is shortened. In addition, the colors showing regions of elevation increase and decrease over the Greenland ice sheet are modified. ||
- ID: 3721 Visualization
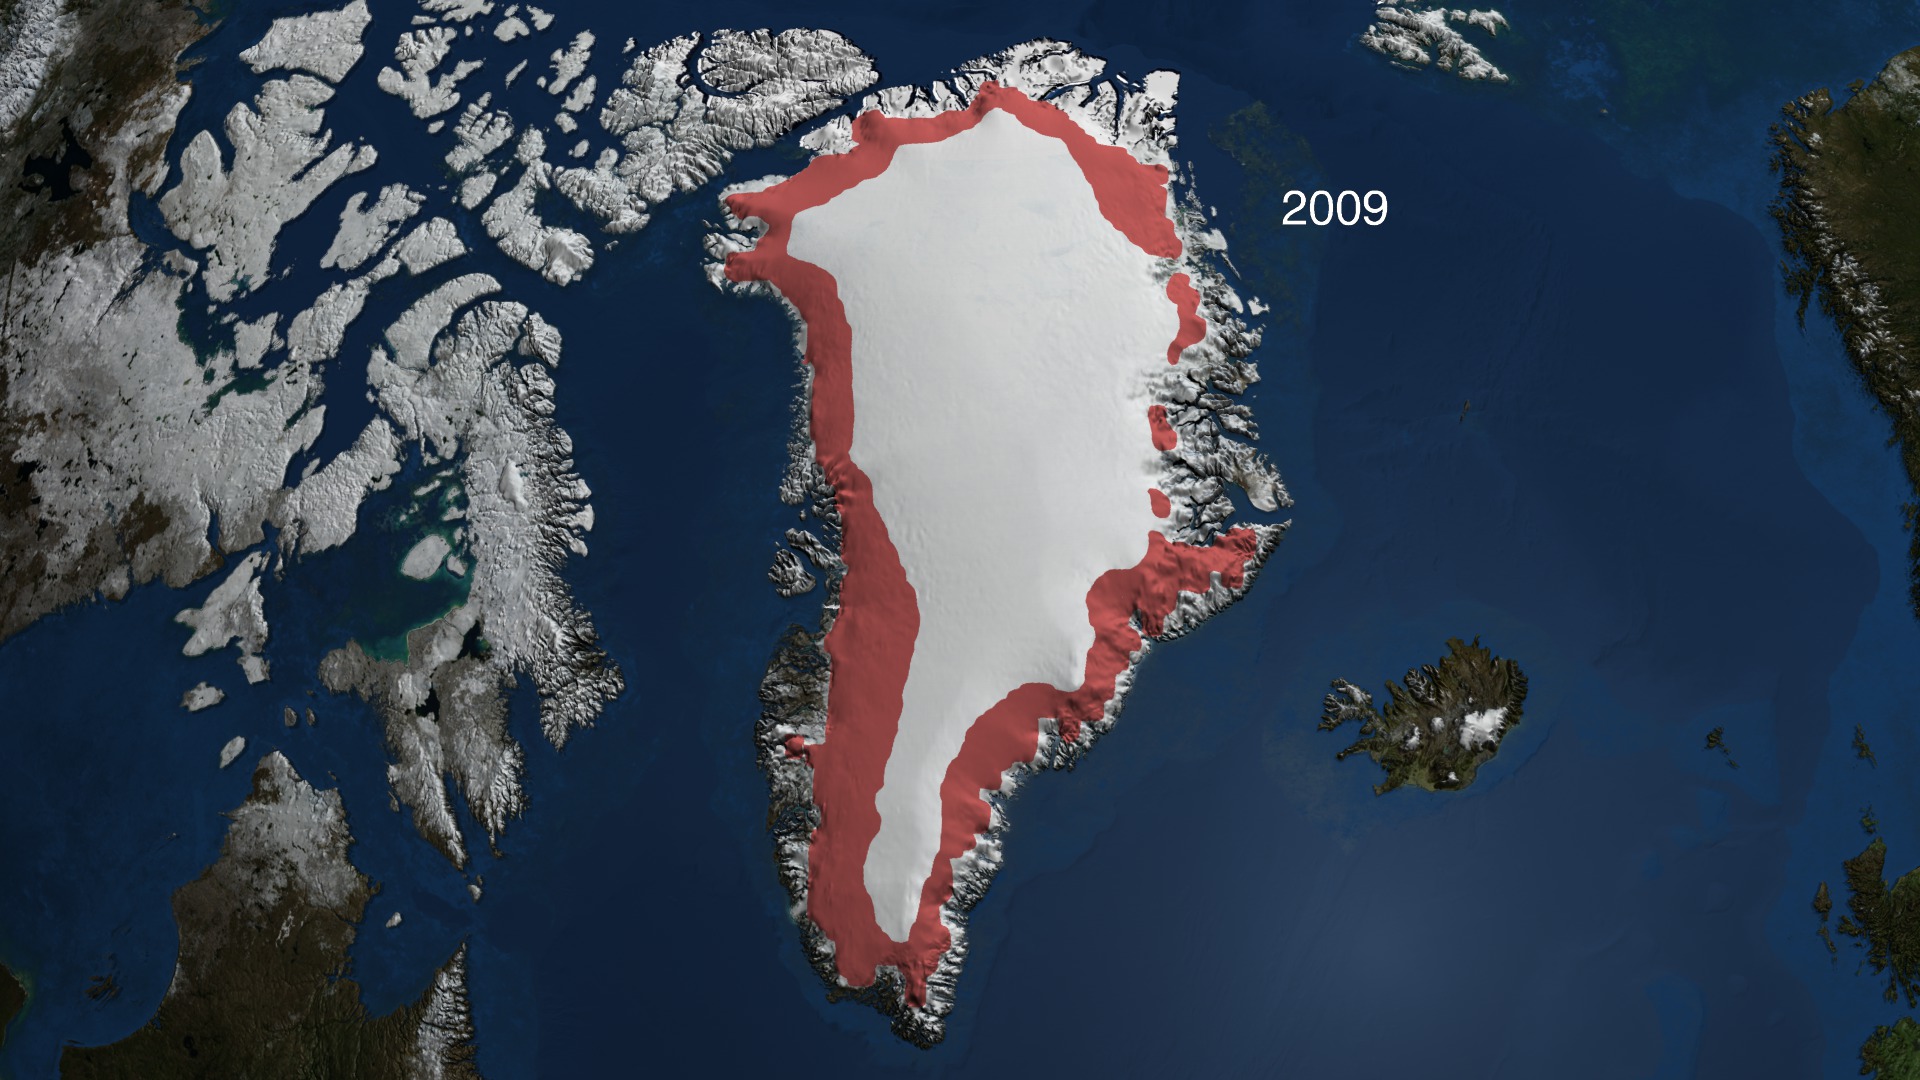
Annual Accumulated Melt over Greenland 1979 through 2009
Go to this pageThe ice sheet melt extent is a daily (or every-other-day, prior to August, 1987) estimate of the spatial extent of wet snow on the Greenland ice sheet derived from passive microwave satellite brightness temperature characteristics. This indicator of melt on each area of the ice sheet for each day of observation is physically based on the changes in microwave emission characteristics observable in data.
- ID: 3698 Visualization
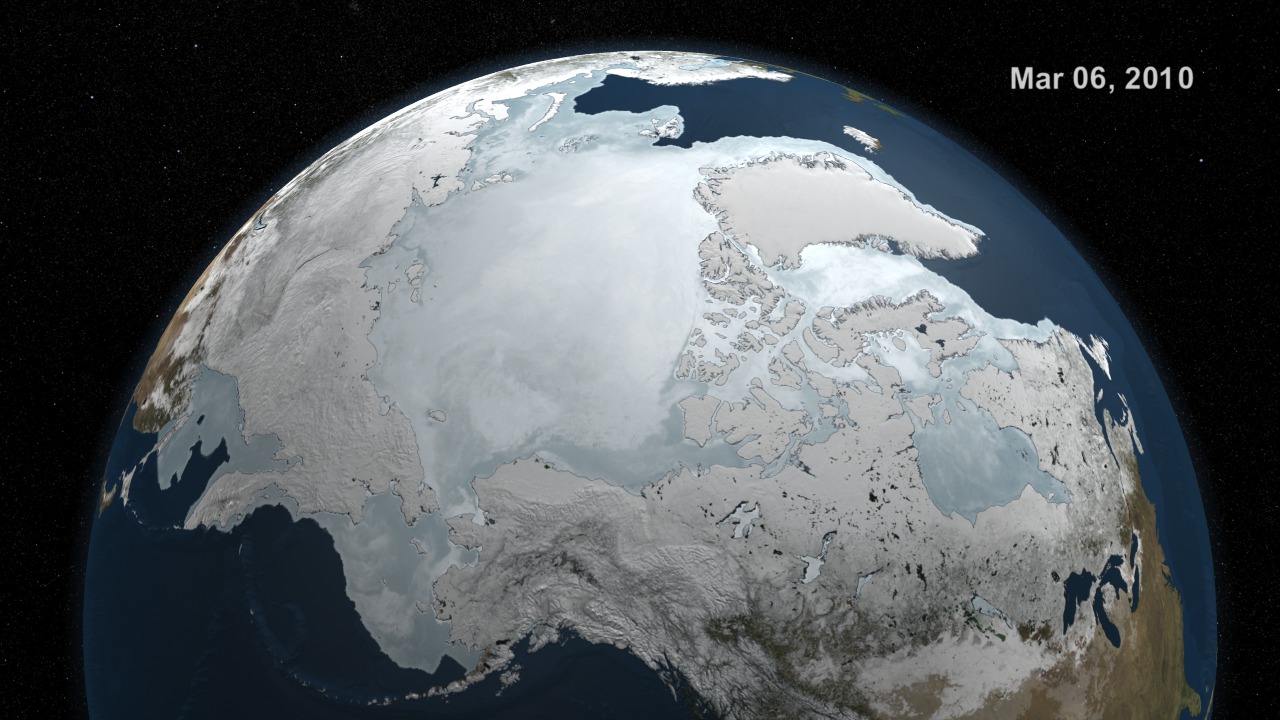
AMSR-E Arctic Sea Ice: September 2009 to March 2010
Go to this pageSea ice is frozen seawater floating on the surface of the ocean. Some sea ice is semi-permanent, persisting from year to year, and some is seasonal, melting and refreezing from season to season. The sea ice cover reaches its minimum extent at the end of each summer and the remaining ice is called the perennial ice cover.In this animation, the Arctic sea ice and seasonal land cover change progress through time, from September 1, 2009 when sea ice in the Arctic was near its minimum extent, through March 30, 2010. The animation plays at a rate of six frames per day or ten days per second. Over the water, Arctic sea ice changes from day to day showing a running 3-day maximum sea ice concentration in the region where the concentration is greater than 15%. The blueish white color of the sea ice is derived from a 3-day running maximum of the AMSR-E 89 GHz brightness temperature. Over the terrain, monthly data from the seasonal Blue Marble Next Generation fades slowly from month to month. ||
Operation IceBridge Spring 2010: Greenland
- ID: 10593 Produced Video
Arctic 2010 Video File - 3/18/10
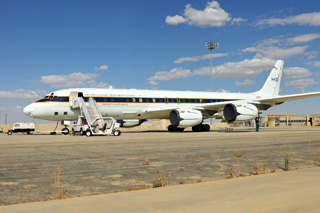
Go to this pageIceBridge launches its spring 2010 campaign to measure Arctic ice. Deploying from NASA's Dryden Flight Research Center, Edwards, Calif., on March 20, IceBridge scientists will fly to Thule, Greenland. Researchers from NASA, University of Kansas, Columbia University and University of North Dakota will spend the next two and a half months surveying Arctic sea ice, ice sheets and glaciers. Ice Bridge will "bridge" data from NASA's ICESat and ICESat-2 satellites to provide a continuous look at how Arctic ice is changing. ||
- ID: 10603 Produced Video
Arctic 2010 Video File - April 23, 2010
Go to this pageNASA's Operation IceBridge enters the second phase of the Arctic 2010 campaign in Greenland. Next week, NASA's DC-8 aircraft will return from Thule Air Base in Greenland to Dryden Flight Research Center in California. The fully equipped P-3B airplane will deploy from NASA's Wallops Flight Facility in Virginia to Kangerlussuaq, Greenland for the remainder of the mission. The mission is measuring the Arctic ice sheet, glaciers and sea ice. ||
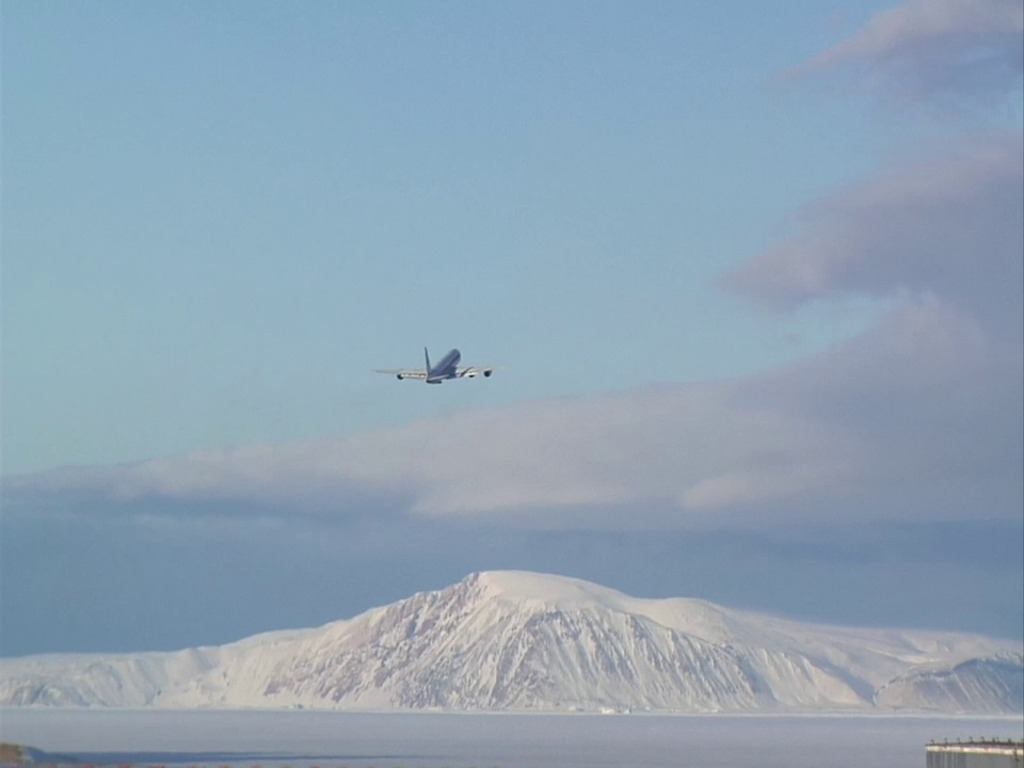
NASA's Arctic Voyage Video File
The ICESCAPE mission, which stands for "Impacts of Climate on Ecosystems and Chemistry of the Arctic Pacific Environment," is NASA's first dedicated oceanographic field campaign. During the summer of 2009, scientists investigated the impacts of climate change on the ecology and biogeochemistry of the Chukchi and Beaufort seas along Alaska's northern coast. ICESCAPE took to sea onboard the U.S. Coast Guard Cutter Healy, the United States' newest and most technologically advanced polar icebreaker. The Healy conducts a wide range of research activities and is designed to break four-and-a-half feet of ice continuously at three knots.
- ID: 10695 Produced Video
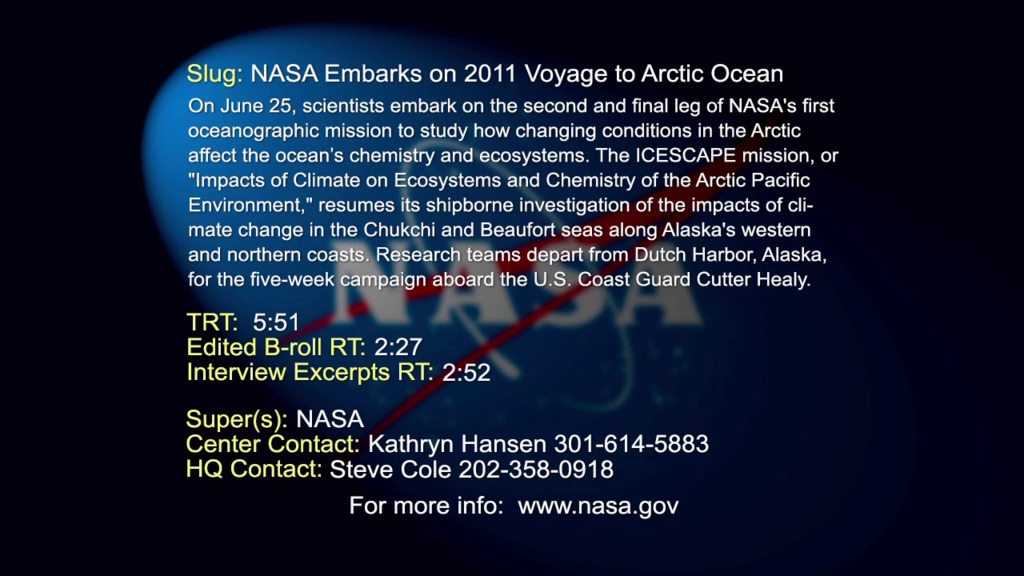
NASA's Oceanographic Voyage - ICESCAPE
Go to this pageThe ICESCAPE mission, or "Impacts of Climate on Ecosystems and Chemistry of the Arctic Pacific Environment," is NASA's first dedicated oceanographic field campaign. From June-July 2010, scientists onboard the U.S. Coast Guard Cutter Healy spent five weeks at sea studying how changing conditions in the Arctic affect the ocean's chemistry and ecosystems. On June 25, 2011, researchers embark on the mission's second and final campaign. The multiyear observations collected from the icebreaker will help us interpret what instruments in space tell us, as well as turn up some new discoveries. ||