Arctic and Antarctic Sea Ice
Overview
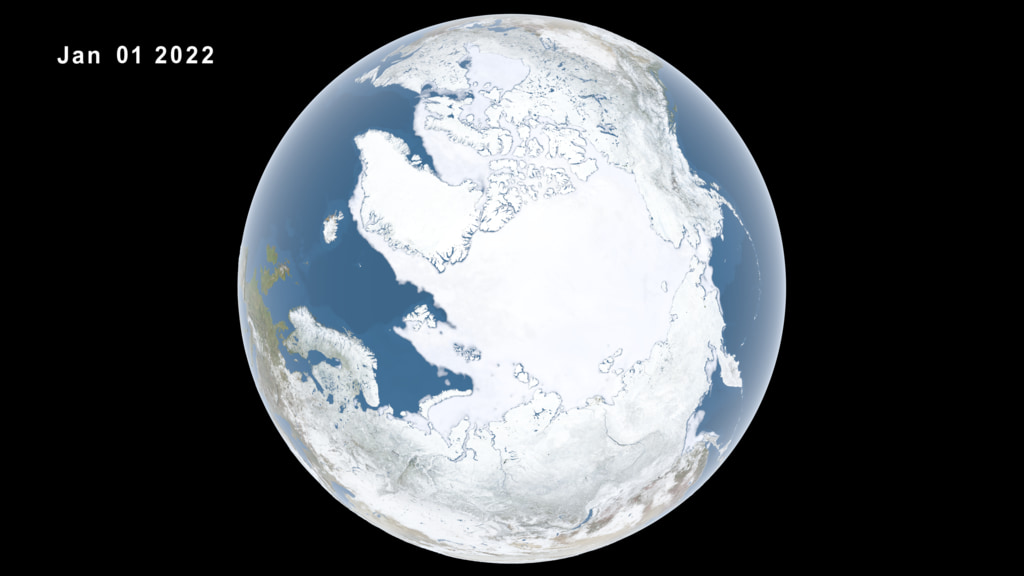
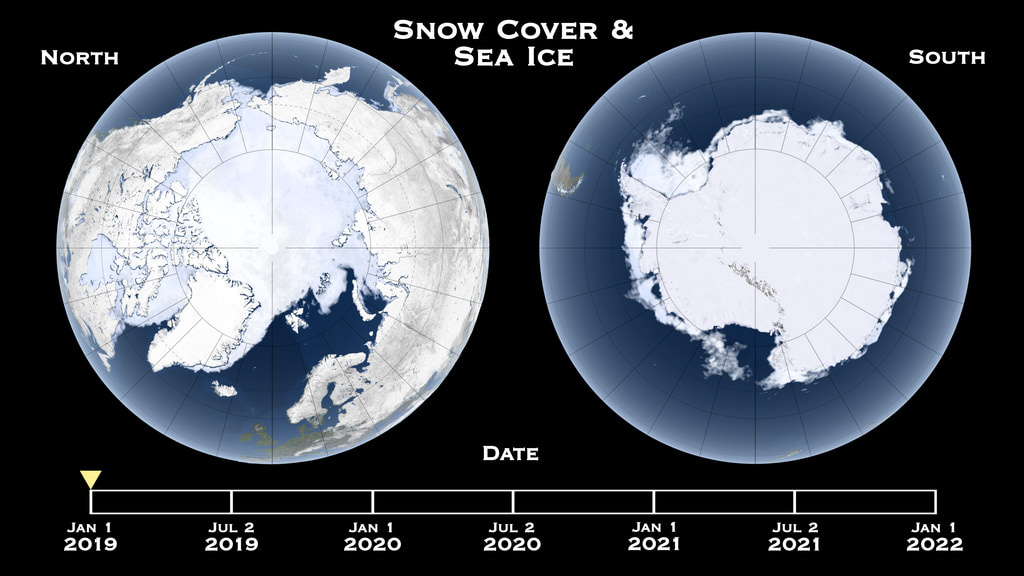
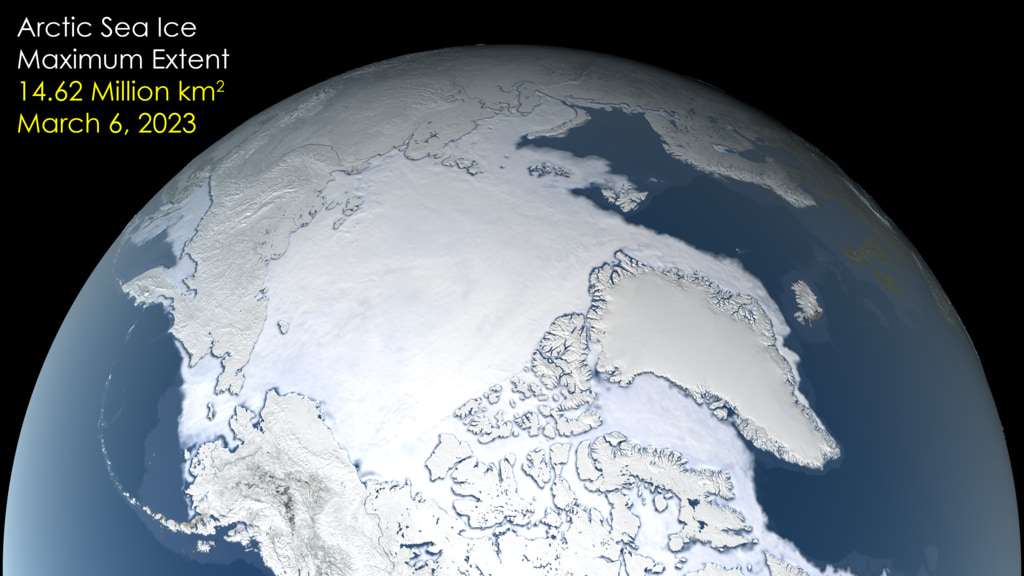
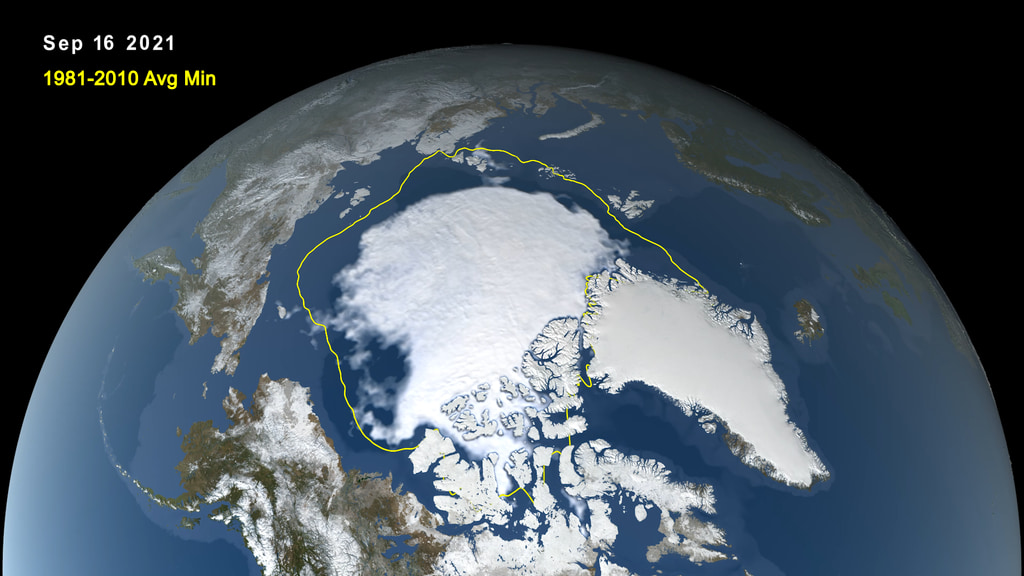
Sea ice cover is a key indicator of the Earth's polar climate system.
See also these vital signs from climate.nasa.gov:
Recent Visualizations

- ID: 5046
 Visualization
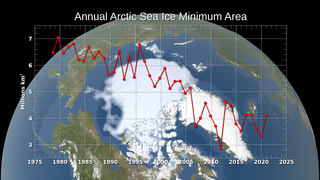
- ID: 4995
 Visualization
 - ID: 5091
 Visualization
 - ID: 4988
 Visualization
 - ID: 31166
 Hyperwall Visual
 - ID: 4941
 Visualization
 - ID: 4888
- ID: 31158
 Hyperwall Visual
 - ID: 13825
![Music: Amazing Discoveries by Damien Deshayes [SACEM]Complete transcript available.](/vis/a010000/a013800/a013825/Screen_Shot_2021-03-29_at_2.25.23_PM_print.jpg)
- ID: 31156
 Hyperwall Visual
 - ID: 4804
 Visualization
 - ID: 10492
 Produced Video
Older live shots, photos, interviews, and broll
 Link
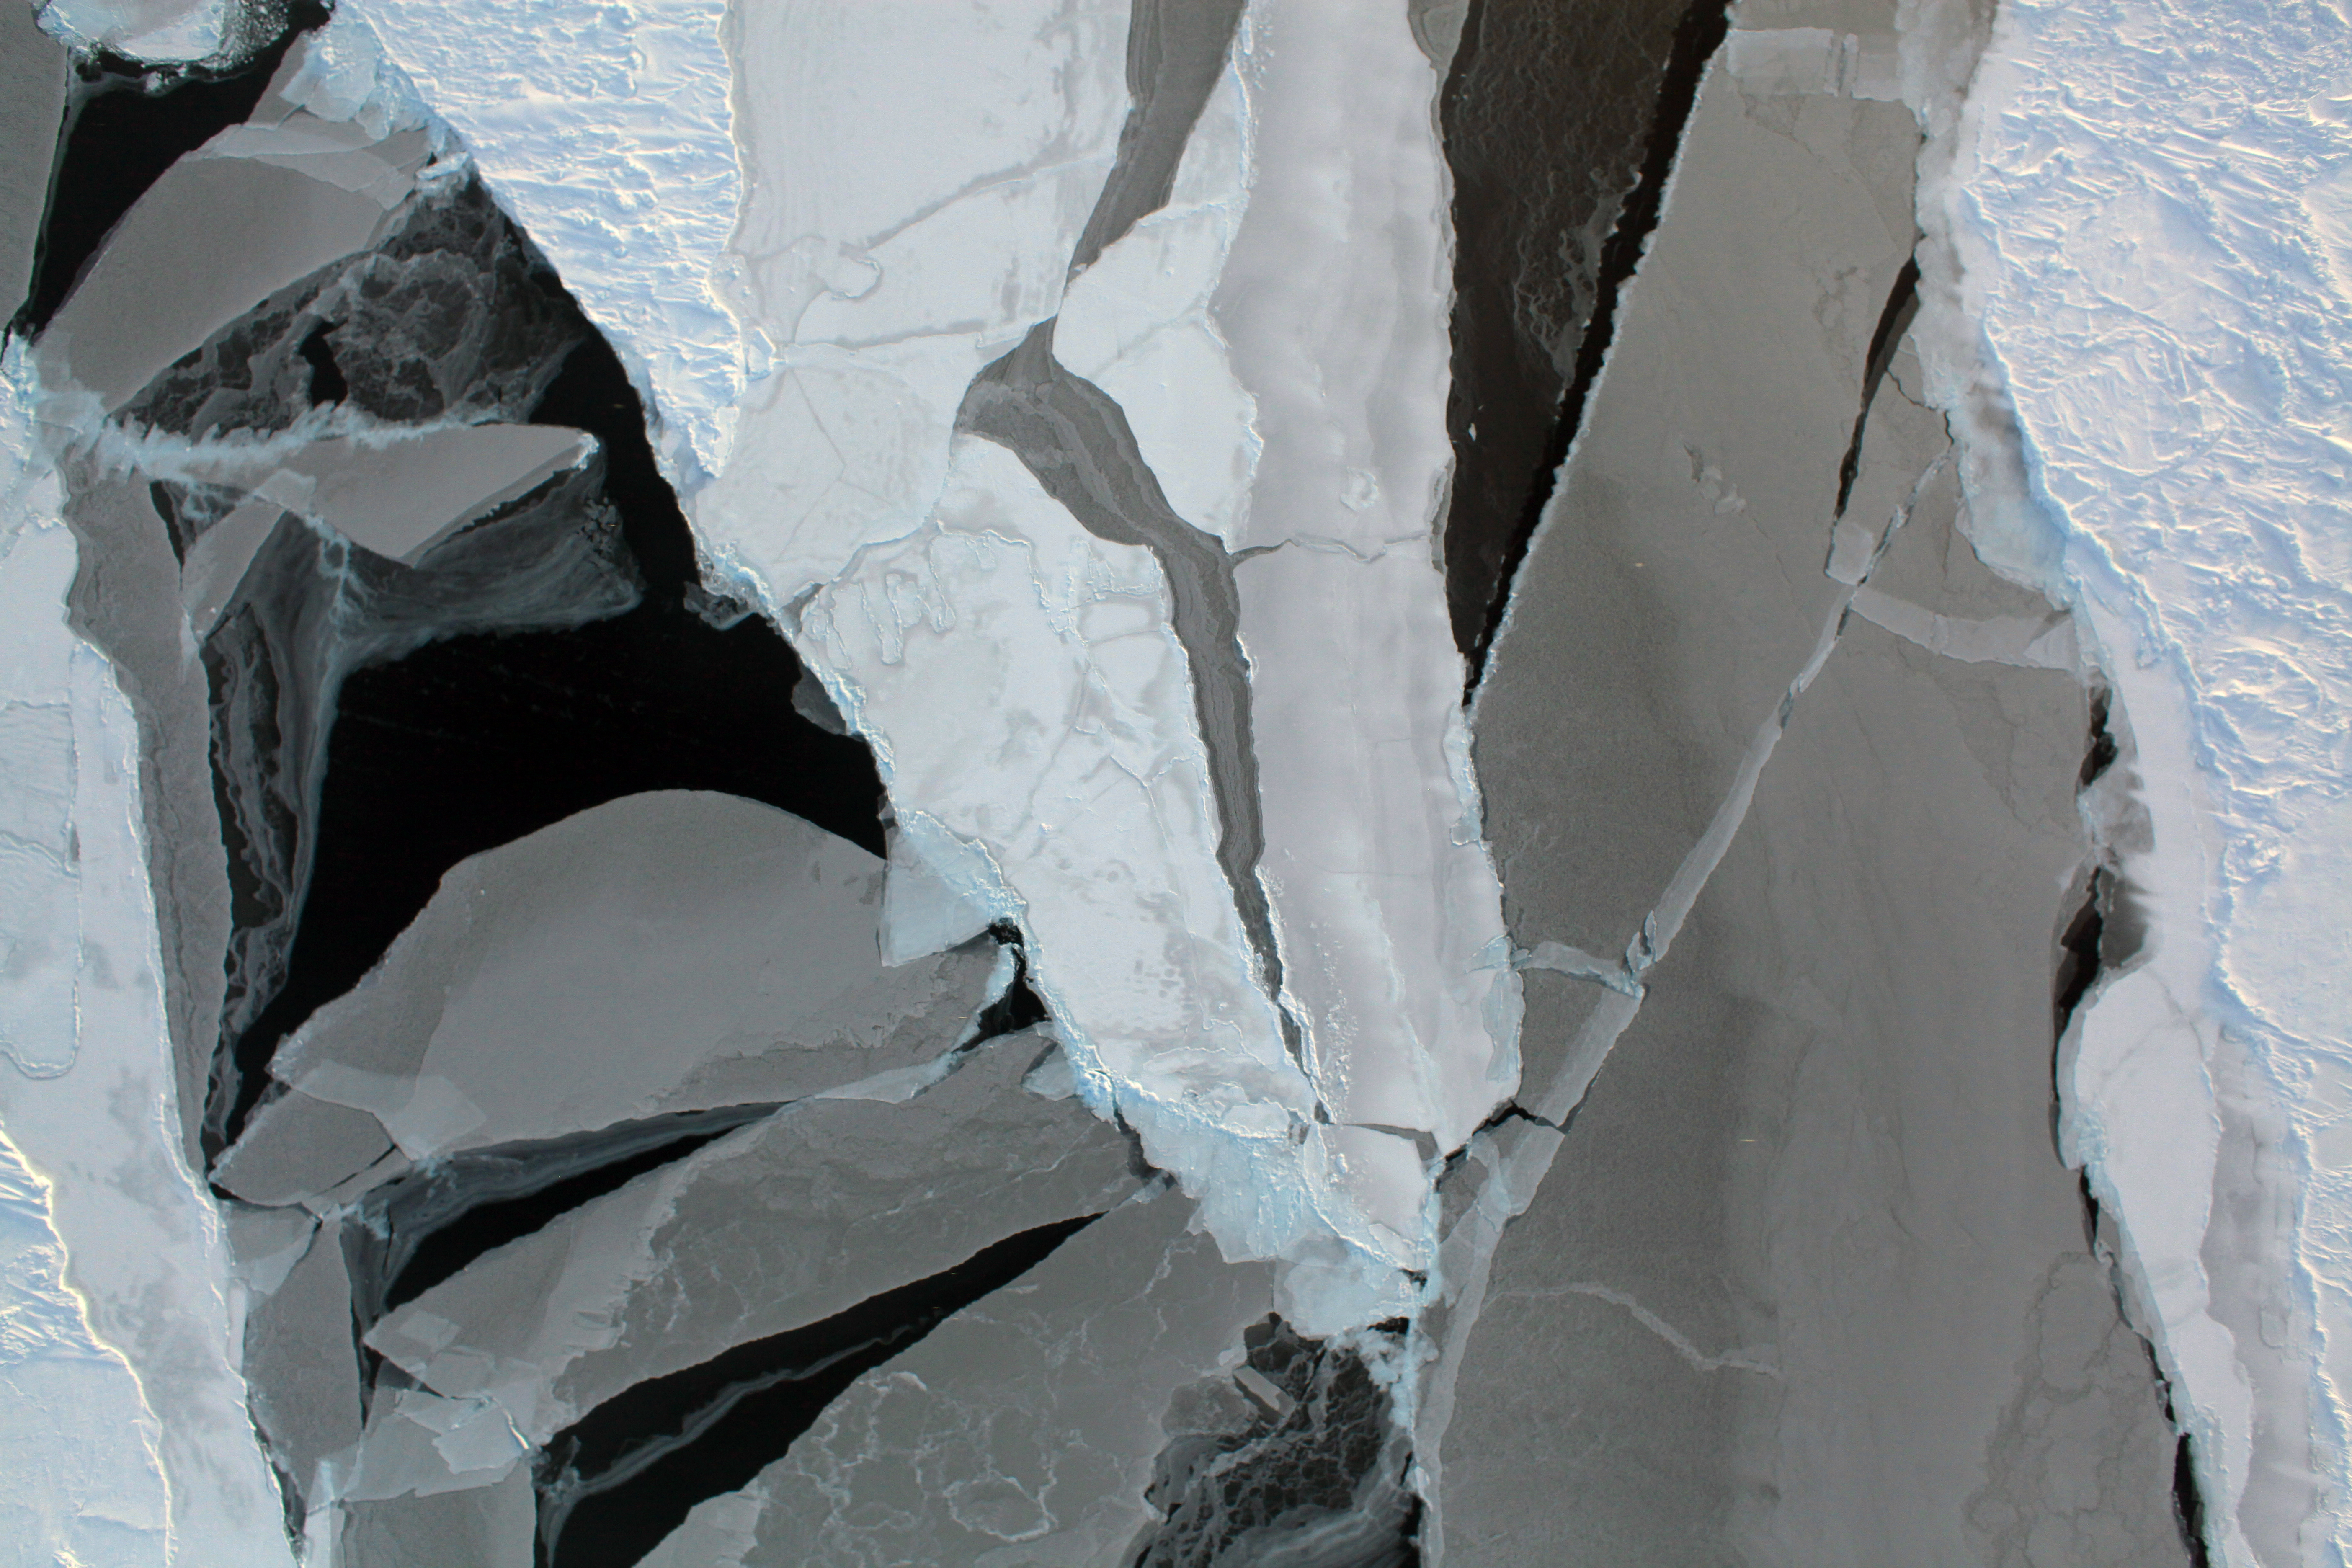
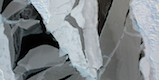
LinkVaried sea ice
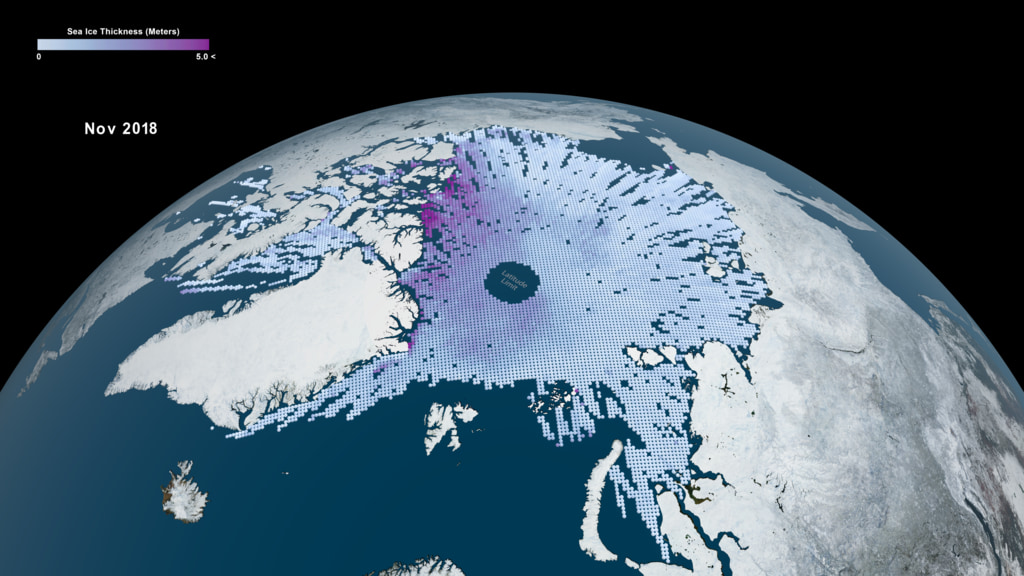
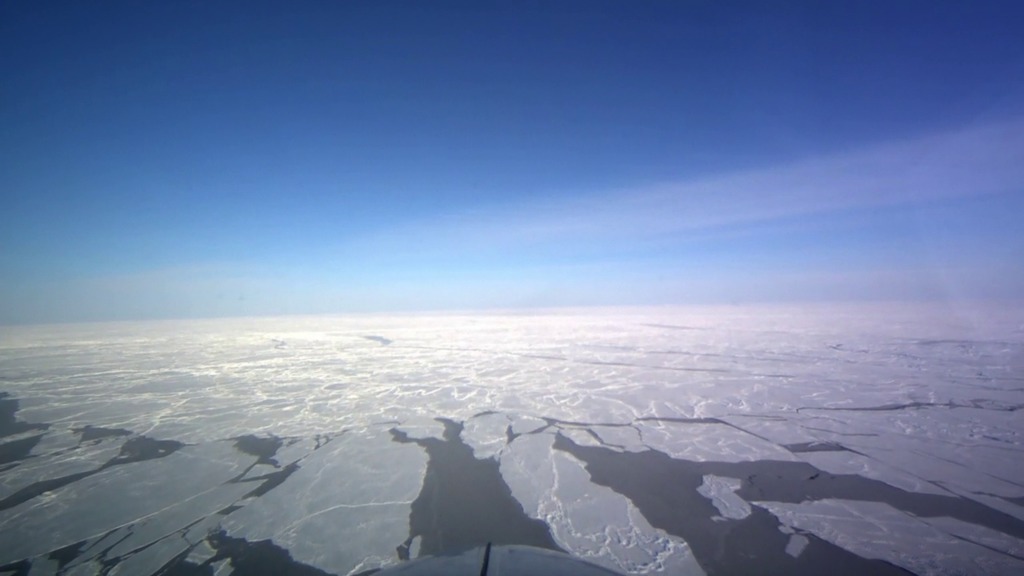
Sea ice can take many forms, as seen in this image of Arctic sea ice from the DMS instrument from a recent Operation IceBridge aerial survey. Varying thicknesses of sea ice are shown here, from thin, nearly transparent layers to thicker, older sea ice covered with snow.
Go to this link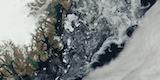 Link
LinkEast Coast of Greenland Terra MODIS Aug. 17, 2012
Sea ice swirls in ocean currents off the east coast of Greenland on Aug. 17, 2012, as seen by the MODIS instrument on board the Terra satellite. Greenland's ice sheet and outlet glaciers can also be seen at left.
Go to this link

- ID: 11343 Produced Video
Arctic sea ice live shots 2013
Go to this pageOn Friday August 23, 2013, scientists at NASA's Goddard Space Flight Center talked to television stations from around the country about the Arctic and the changes taking place to sea ice in this region. See below for interviews in English with Tom Wagner and Walt Meier, an interview in Spanish with Carlos del Castillo, and footage and data visualizations of sea ice.For more information please click here. ||