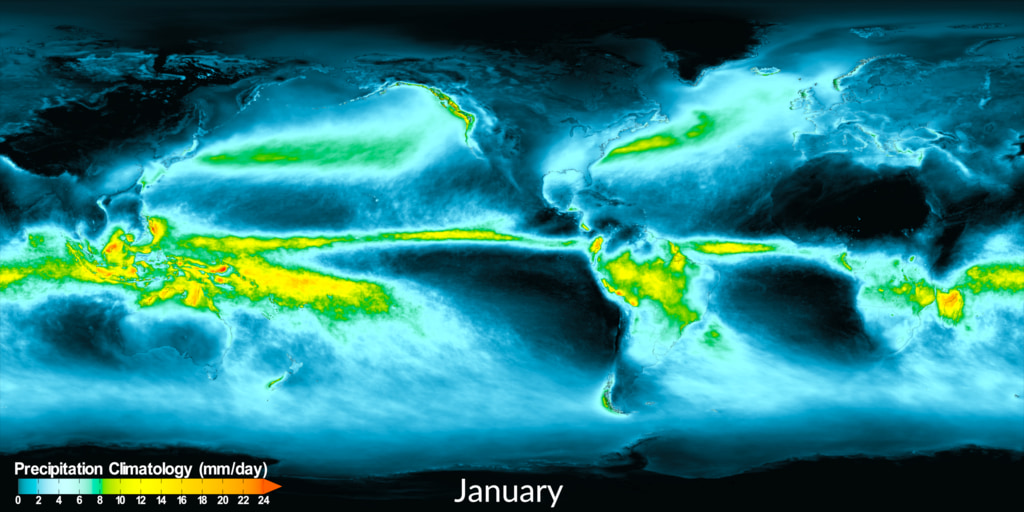
IMERG Daily Precipitation Climatology (2001 - 2022)
Example composite showing the 30 day moving average daily precipitation climatology along with the date and colorbar.
This updated daily precipitation climatology dataset covers January 2001 to December 2022 computed as a trailing 30-day average to reduce the random noise due to isolated big events. Notable features include the annual cycle of the InterTropical Convergence Zone (ITCZ) following the motion of the Sun (with a time lag) over both land and ocean, the seasonal shift of the Asian Monsoon between South Asia in the boreal summer and Australia in the boreal winter, the North American Monsoon in the late boreal summer in northern Mexico and southwestern U.S., and the dry summer/wet winter pattern in the Mediterranean Sea area and the west coast of the U.S.
Daily precipitation climatology with a 30 day trailing average including dates.
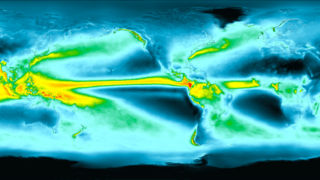
Daily precipitation climatology with a 30 day trailing average. This is the clean version without dates or a colorbar.

This is the colorbar for the daily (30 day trailing average) precipitation climatology rates across the globe. The precipitation climatology rates are shown in millimeters per day. Cool colors (ie, blue and green) are areas that receive low amounts of precipitation for a given day. Warmer colors (yellow, orange, and red) receive higher amounts of precipitation for the given day.
Credits
Please give credit for this item to:
NASA's Scientific Visualization Studio
-
Visualizer
- Alex Kekesi (Global Science and Technology, Inc.)
-
Scientists
- George Huffman (NASA/GSFC)
- Jackson Tan (University of Maryland)
-
Technical support
- Laurence Schuler (ADNET Systems, Inc.)
- Ian Jones (ADNET Systems, Inc.)
Release date
This page was originally published on Friday, March 29, 2024.
This page was last updated on Thursday, March 28, 2024 at 4:18 PM EDT.
Datasets used in this visualization
-
IMERG
ID: 863This dataset can be found at: http://pmm.nasa.gov/sites/default/files/document_files/IMERG_ATBD_V4.4.pdf
See all pages that use this dataset
Note: While we identify the data sets used in these visualizations, we do not store any further details, nor the data sets themselves on our site.
Related
- ID: 5237
 Visualization
 - ID: 5241
 Visualization