Mars Disappearing Solar Wind: MAVEN Visualizations
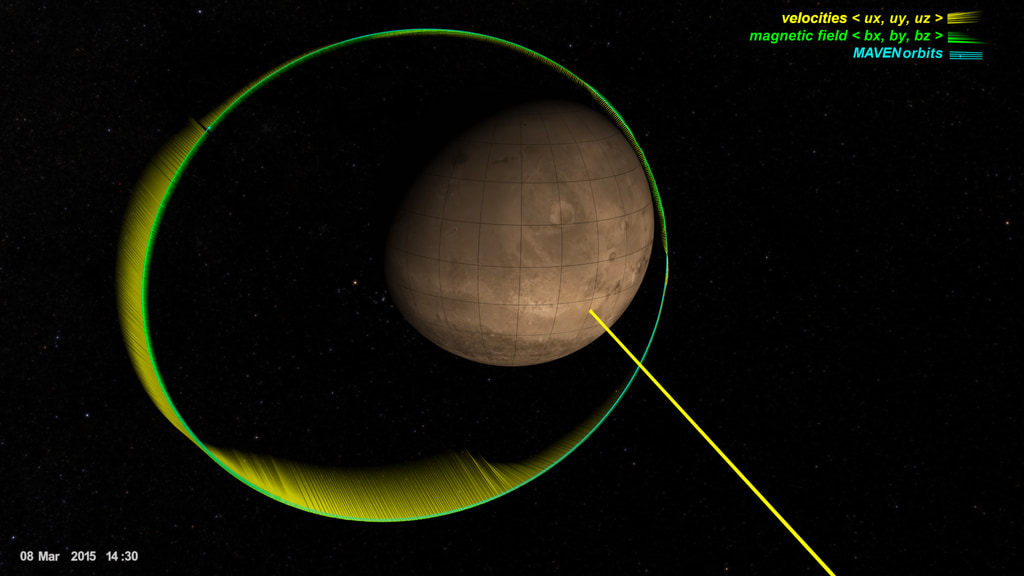
This data visualization depicts a period of decreased solar wind at Mars that occurred on December 25, 2022, causing the planet’s magnetosphere to expand outward. Ion velocity and density data collected by the MAVEN spacecraft is presented using a color-mapped satellite orbit tail and vectors along MAVEN’s orbit.
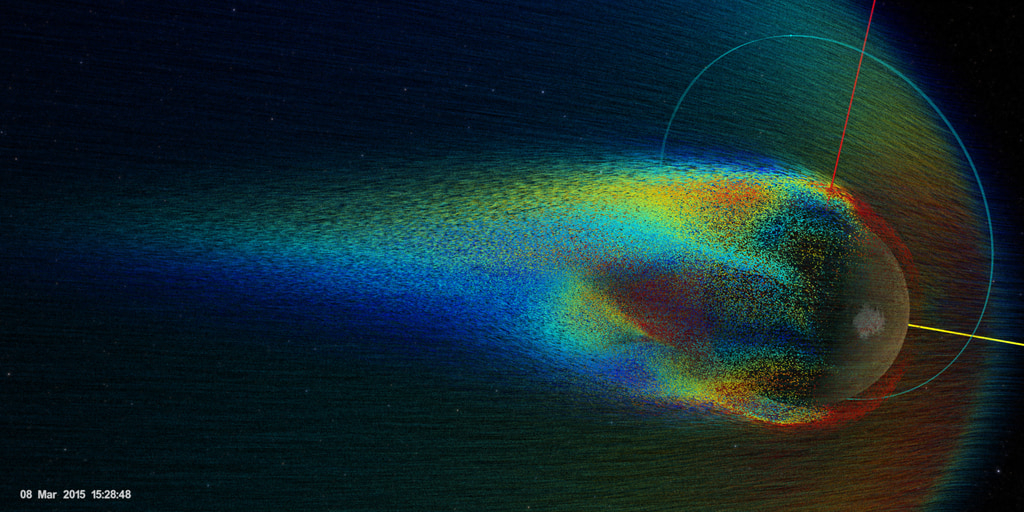
In December 2022, NASA’s Mars-orbiting MAVEN mission observed the dramatic and unexpected “disappearance” of the solar wind, a stream of charged particles that continuously emanates from the Sun. This was caused by a special type of solar event that was so powerful, it created a void in its wake as it traveled through the solar system. The Martian atmosphere and magnetosphere expanded by thousands of kilometers in response, causing the solar wind to temporarily vanish from Mars. MAVEN’s observations of this dramatic event are helping scientists to better understand the physics that drive atmospheric and water loss at Mars.
This data visualization depicts a period of decreased solar wind at Mars that occurred on December 25, 2022, causing the planet’s magnetosphere to expand outward. Ion velocity and density data collected by the MAVEN spacecraft is presented using a color-mapped satellite orbit tail and vectors along MAVEN’s orbit. This version does not include a date stamp or legend.
A date stamp layer for the visualizations above.

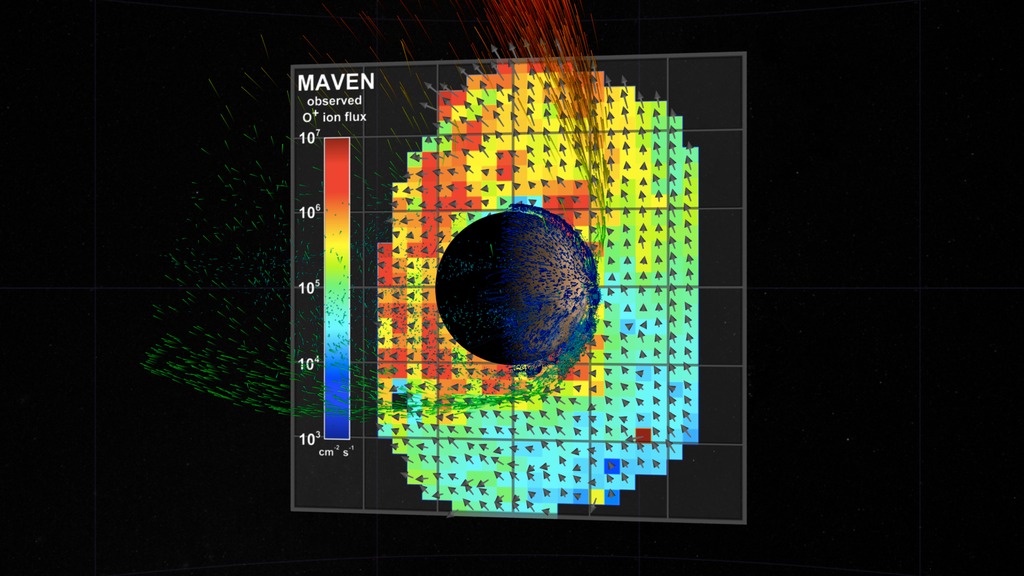
Legend and color bars for light ion velocity (vector length), light ion density (purple to white), and heavy ion density (green to red).
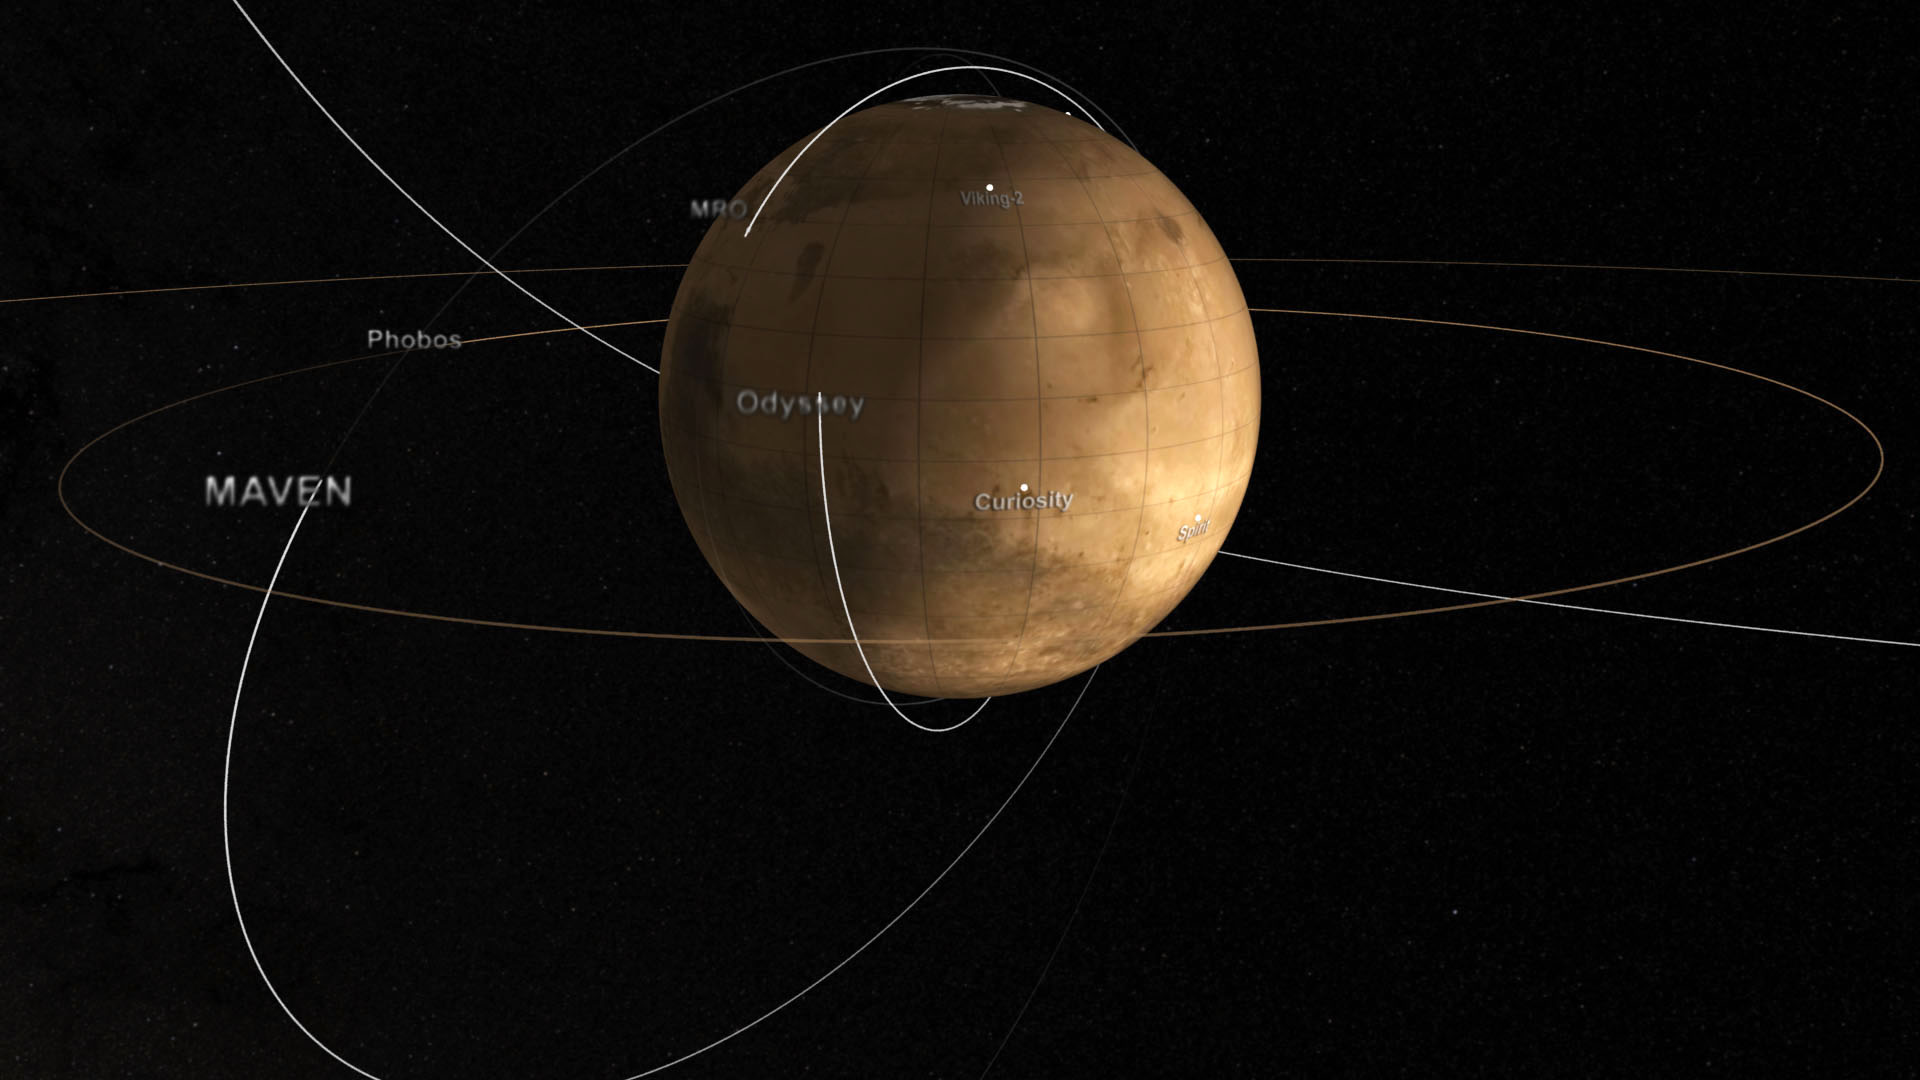
A zoomed in view of MAVEN’s orbit during a period of low solar wind.
This data visualization depicts a period of decreased solar wind at Mars that occurred on December 25, 2022, causing the planet’s magnetosphere to expand outward. Ion velocity and density data collected by the MAVEN spacecraft is presented using a color-mapped satellite orbit tail and vectors along MAVEN’s orbit. This version does not include a date stamp or legend and is in a vertical orientation.
For More Information
See the following sources:
Credits
Please give credit for this item to:
NASA's Scientific Visualization Studio
-
Visualizers
- Kel Elkins (USRA)
- Greg Shirah (NASA/GSFC)
-
Producer
- Dan Gallagher (KBR Wyle Services, LLC)
-
Communications
- Willow Reed (University of Colorado Boulder)
-
Scientists
- Jasper Halekas (University of Iowa)
- Skylar Shaver (University of Colorado Boulder)
- Abigail Azari (University of California, Berkeley)
- Yingjuan Ma (UCLA)
- Shannon Curry (University of California, Berkeley)
-
Public affairs
- Nancy Neal-Jones (NASA/GSFC)
Release date
This page was originally published on Monday, December 11, 2023.
This page was last updated on Thursday, December 21, 2023 at 10:58 PM EST.
Missions
This visualization is related to the following missions:Datasets used in this visualization
-
SPICE Ephemerides (SPICE Ephemerides)
ID: 755Satellite and planetary ephemerides
See all pages that use this dataset -
Average Solar Wind Flow [MAVEN]
ID: 899 -
Magnetic Field Vectors [MAVEN: MAG]
ID: 1082 -
Ion Fluxes [MAVEN: SWIA]
ID: 1083
Note: While we identify the data sets used in these visualizations, we do not store any further details, nor the data sets themselves on our site.
Related
- ID: 4824
- ID: 4825
 Visualization
 - ID: 4414
 Visualization
 - ID: 4370
 Visualization
Used as a Source In
- ID: 14477
![Learn about the “disappearance” of the solar wind at Mars that was witnessed by MAVEN – an event last seen nearly a quarter-century ago at Earth.Complete transcript available.Universal Production Music: “Space Museum” by Harry Gregson Williams [BMI], Atmosphere Music Ltd. [PRS]; “Currents and Crime Scenes” by Dylan Matthew Love and Harry Gregson Williams [BMI], Atmosphere Music Ltd. [PRS]Watch this video on the NASA Goddard YouTube channel.](/vis/a010000/a014400/a014477/MAVEN_Solar_Wind_Disappear_V4.jpg) Produced Video
Produced Video