Nitrogen Dioxide Over the United States, 2005-2022
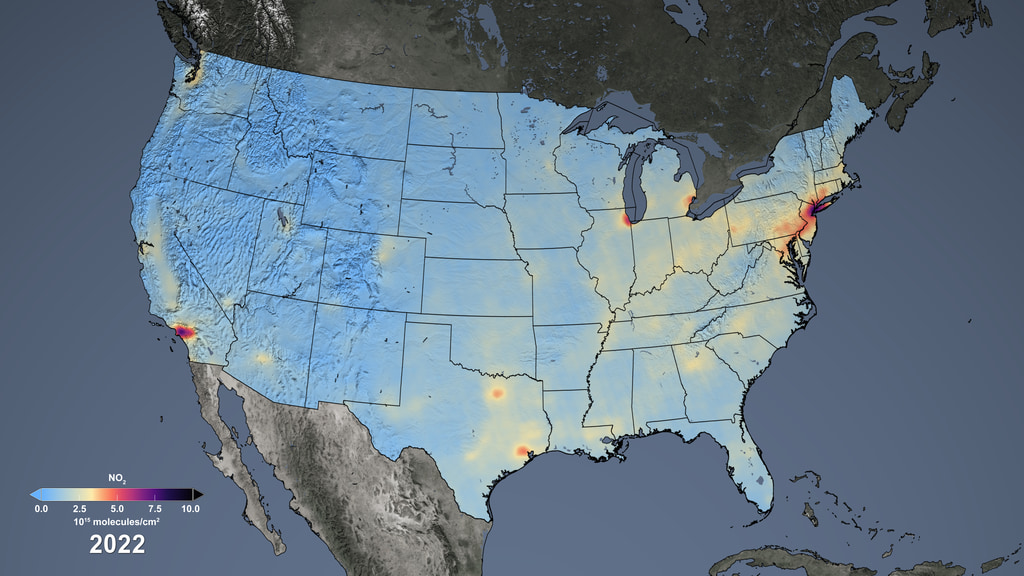
NO2 over the United States as measured by OMI, with labels
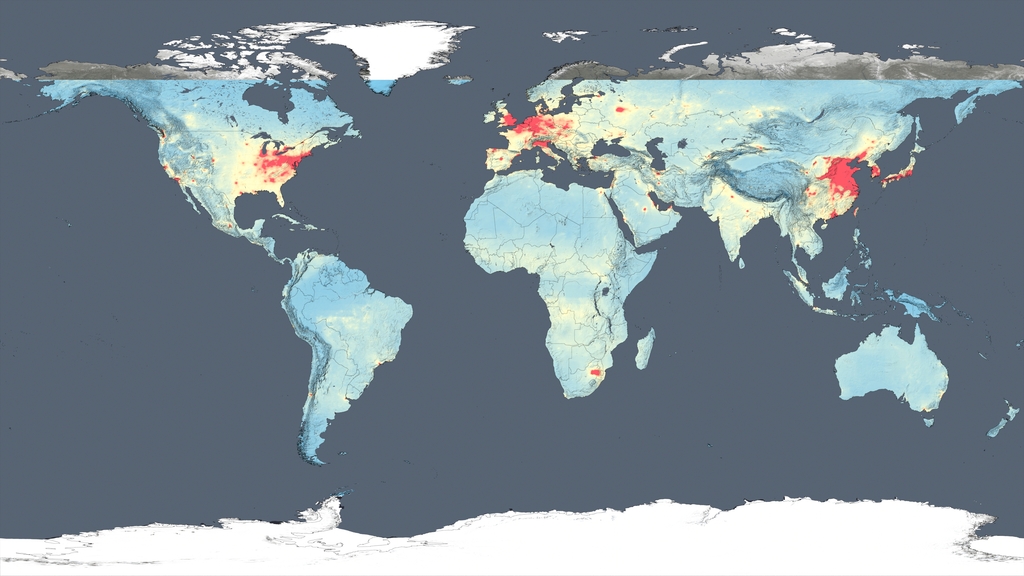
Nitrogen dioxide can impact the respiratory system, and it also contributes to the formation of other pollutants including ground-level ozone and particulates. The gas is produced primarily during the combustion of gasoline in vehicle engines and coal in power plants. Air pollution has decreased even though population and the number of cars on the roads have increased. The shift is the result of regulations, technology improvements and economic changes, scientists say.
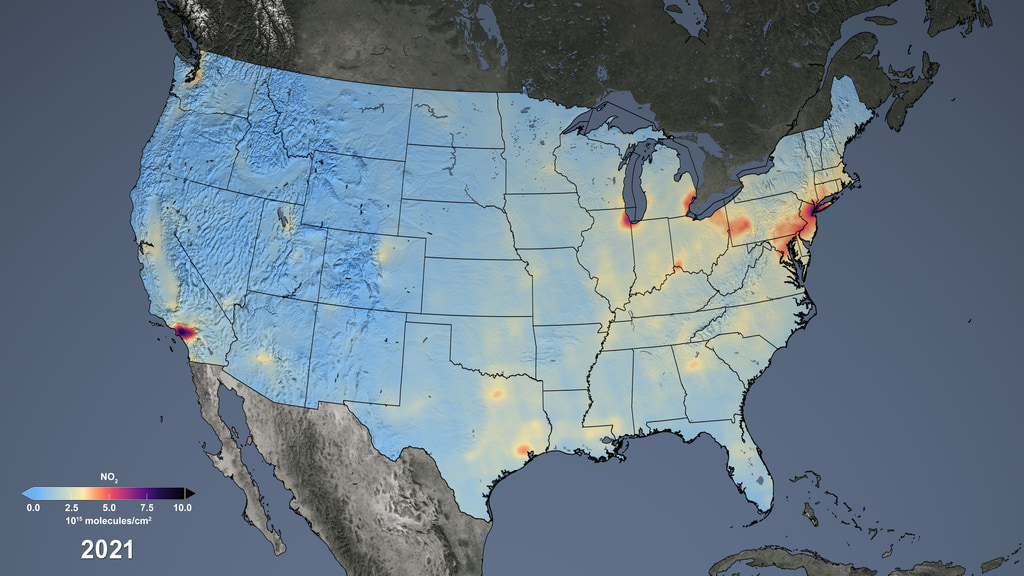
This visualization shows tropospheric column concentrations of nitrogen dioxide as detected by the Ozone Monitoring Instrument (OMI) on NASA's Aura satellite, averaged yearly from 2005-2022.
NO2 over the United States as measured by OMI, no labels
NO2 over the United States as measured by OMI, no labels, by year. Each year 2005-2022 can be accessed through the drop-down menu for this item.
Years only, 2005-2022

NO2 colorbar, 0.0-10.0x10¹⁵ molecules/cm2
Credits
Please give credit for this item to:
NASA's Scientific Visualization Studio
-
Visualizer
- Trent L. Schindler (USRA)
-
Scientists
- Bryan Duncan (NASA/GSFC)
- Lok Lamsal (University of Maryland, Baltimore County)
Release date
This page was originally published on Monday, February 6, 2023.
This page was last updated on Sunday, January 7, 2024 at 12:18 AM EST.
Datasets used in this visualization
-
[Aura: OMI]
ID: 147
Note: While we identify the data sets used in these visualizations, we do not store any further details, nor the data sets themselves on our site.
Related
- ID: 5107
 Visualization
 - ID: 5104

- ID: 14327
Older Versions
- ID: 4994
 Visualization
Sources
- ID: 4412