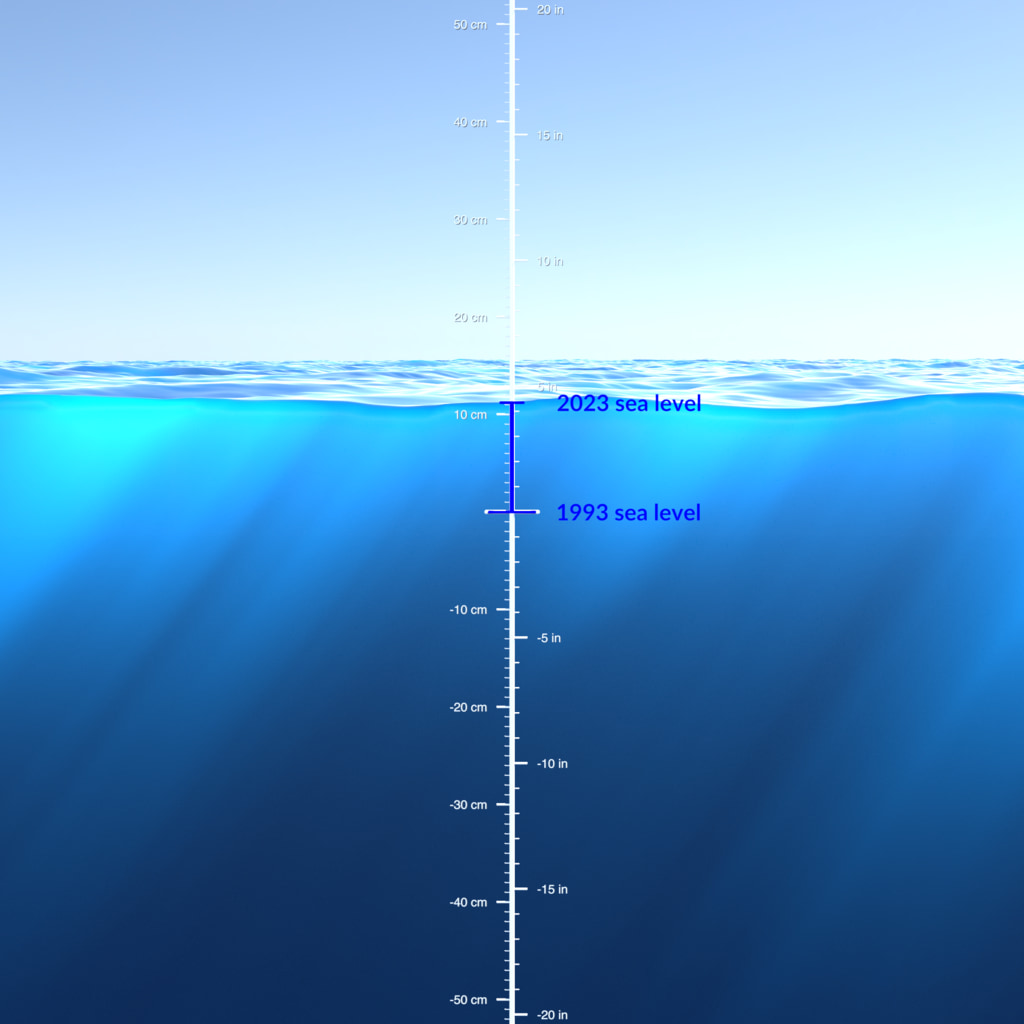
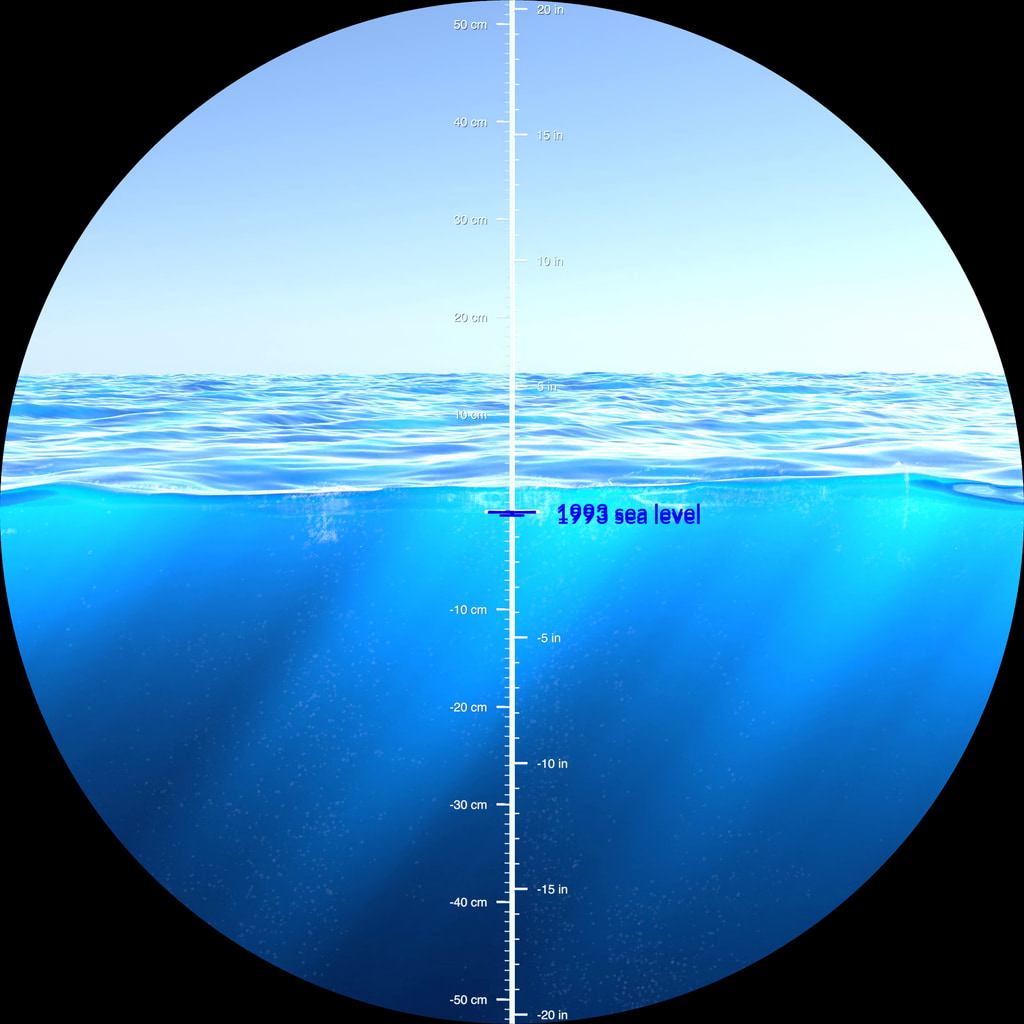
27-year Sea Level Rise - TOPEX/JASON
Sea surface height change from 1992 to 2019, with colorbar
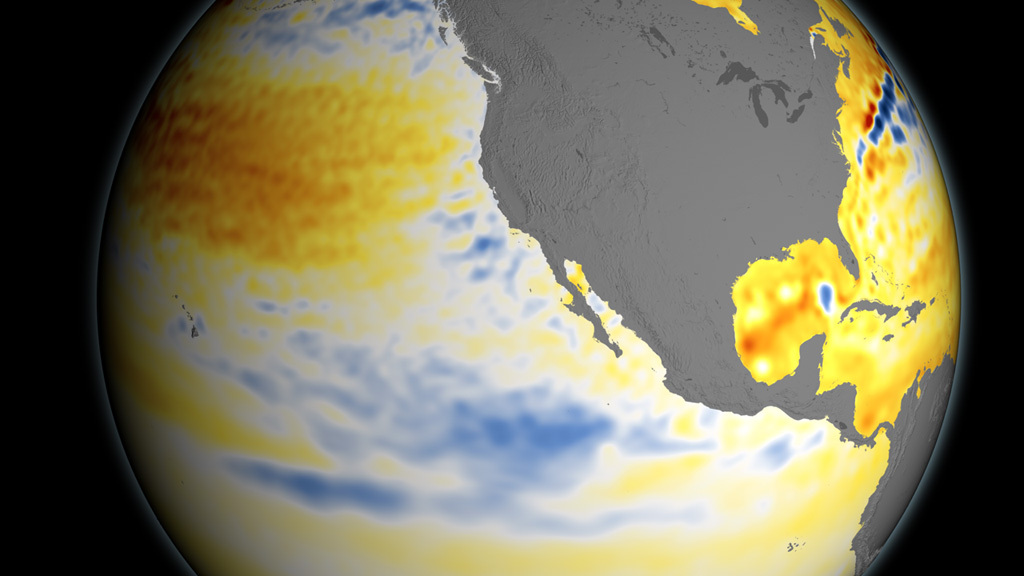
This visualization shows total sea level change between 1992 and 2019, based on data collected from the TOPEX/Poseidon, Jason-1, Jason-2, and Jason-3 satellites. Blue regions are where sea level has gone down, and orange/red regions are where sea level has gone up. Since 1992, seas around the world have risen an average of nearly 6 inches.
The color range for this visualization is -15 cm to +15 cm (-5.9 inches to +5.9 inches), though measured data extends above and below 15 cm (5.9 inches). This particular range was chosen to highlight variations in sea level change.
Sea surface height change from 1992 to 2019, no colorbar

Sea surface height change in the Pacific region from 1992 to 2019, with colorbar
Sea surface height change in the Pacific region from 1992 to 2019, no colorbar
Sea surface height change from 1992 to 2019, with colorbar, flat projection
Sea surface height change from 1992 to 2019, no colorbar, flat projection
Colorbar
Credits
Please give credit for this item to:
NASA's Scientific Visualization Studio
-
Visualizers
- Devika Elakara (GSFC Interns)
- Trent L. Schindler (USRA)
- Kel Elkins (USRA)
-
Producer
- Patrick Lynch (Wyle Information Systems)
-
Scientist
- Josh Willis (JPL)
Release date
This page was originally published on Thursday, November 5, 2020.
This page was last updated on Sunday, March 24, 2024 at 12:12 AM EDT.
Missions
This visualization is related to the following missions:Datasets used in this visualization
-
[TOPEX: Poseidon]
ID: 105 -
Sea Surface Height [Jason-1: Altimeter]
ID: 332 -
SSH (Sea Surface Height) [Jason-2: CNES Poseidon-3 Altimeter]
ID: 668
Note: While we identify the data sets used in these visualizations, we do not store any further details, nor the data sets themselves on our site.
Related
- ID: 5235
 Visualization
 - ID: 5114
 Visualization
 - ID: 13746

- ID: 11927
 Produced Video
 - ID: 11988
 Produced Video
 - ID: 11976
 Produced Video
Used as a Source In
- ID: 14043
 Produced Video
 - ID: 31168
 Hyperwall Visual
 - ID: 13747
![Music: Rain over the Sea by Bruno Vouillon [SACEM]Complete transcript available.](/vis/a010000/a013700/a013747/Thumbnail0.jpg) Produced Video
Produced Video - ID: 12849
![Music: Contemporary Art Daily by Laurent Dury [SACEM]Complete transcript available.](/vis/a010000/a012800/a012849/Screen_Shot_2018-02-09_at_2.43.17_PM.png) Produced Video
Produced Video