GOLD Instrument observes the July 2019 Total Solar Eclipse
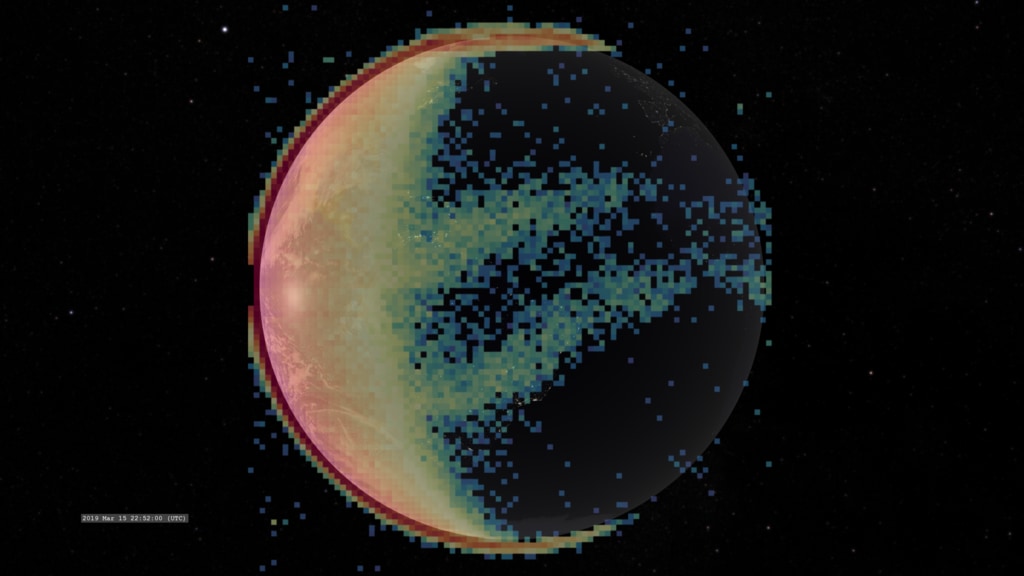
Comparative visualizations of Earth in visible light and the ultraviolet emission of oxygen recombining from ions. The Appleton anomaly is faintly visible above and below the equator on the nightside of the Earth. This version presents the path of the solar eclipse but variations are available in the popup menu to the right.
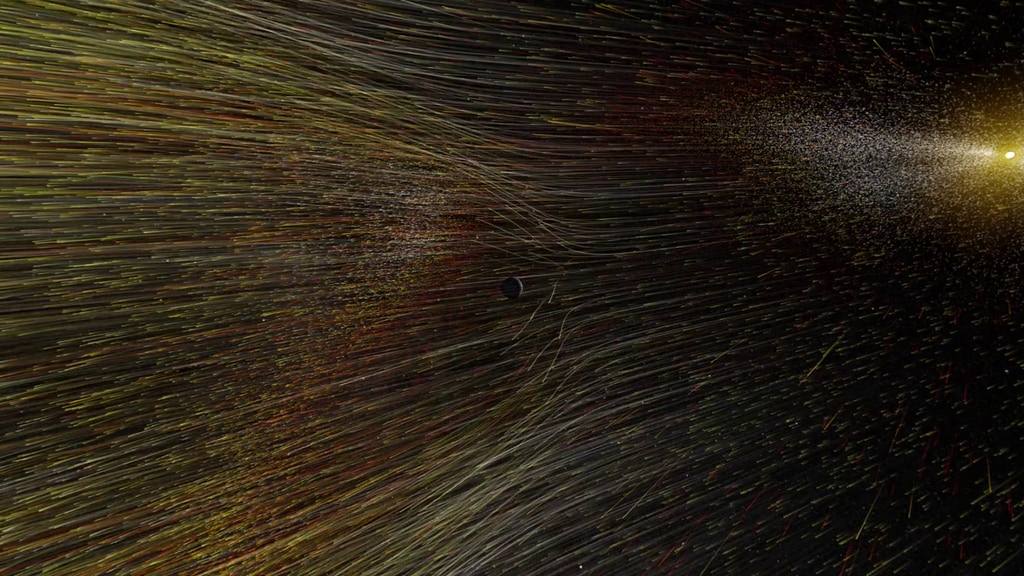
The GOLD instrument aboard the SES 14 satellite observes the Earth in ultraviolet light. In this region of the electromagnetic spectrum, it sees emission of atmospheric ions, atoms and molecules activated by incoming solar radiation.
In these visualizations, we see how the total solar eclipse of July 2012 significantly affected this emission as the Moon's shadow moved across Earth. We also show wavelengths corresponding to two different populations of emitting atoms, the nitrogen LBH bands and the oxygen 135.6nm emission which has a strong contribution from ionized oxygen atoms.
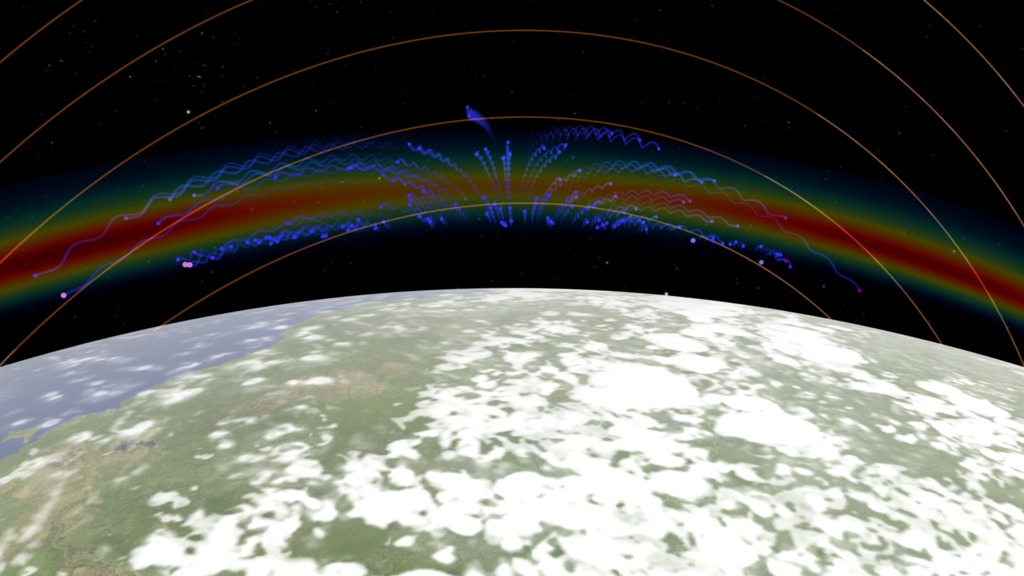
Because the oxygen ions are charged, they respond to the electromagnetic force and exhibit some enhancement straddling the magnetic equator - the Appleton anomaly, which is created by a process called the 'fountain effect'. The nitrogen emission, from atoms with no net electric charge, does not respond to Earth's magnetic field so does not exhibit the Appleton anomaly.
Comparative visualizations of Earth in visible light and the ultraviolet emission of the nitrogen Lyman-Birge-Hopfield (LBH) bands. This version presents the path of the solar eclipse but variations are available in the popup menu to the right.
Comparative visualizations of Earth in the ultraviolet emission of oxygen recombining from ions and ultraviolet emission of the nitrogen Lyman-Birge-Hopfield (LBH) bands. In the oxygen version, the Appleton anomaly is faintly visible above and below the equator on the nightside of the Earth. This version presents the path of the solar eclipse but variations are available in the popup menu to the right.
A visualizations of Earth in the ultraviolet emission of oxygen recombining from ions. The Appleton anomaly is faintly visible above and below the equator on the nightside of the Earth. This version presents the path of the solar eclipse but variations are available in the popup menu to the right.
A visualization of Earth in visible light during the July 2019 total solar eclipse (with cloud data).
A visualization of Earth and the ultraviolet emission of the nitrogen Lyman-Birge-Hopfield (LBH) bands. This version presents the path of the solar eclipse but variations are available in the popup menu to the right.

Colorbar reference for the oxygen 135.6nm ultraviolet emission.
Colorbar reference for the nitrogen Lyman-Birge-Hopfield (LBH) bands ultraviolet emission.
Credits
Please give credit for this item to:
NASA's Scientific Visualization Studio
-
Visualizer
- Tom Bridgman (Global Science and Technology, Inc.)
-
Producers
- Kathalina Tran (SGT)
- Genna Duberstein (USRA)
-
Scientist
- Saurav Aryal (LASP, University of Colorado Boulder)
-
Technical support
- Laurence Schuler (ADNET Systems, Inc.)
- Ian Jones (ADNET Systems, Inc.)
Release date
This page was originally published on Tuesday, December 10, 2019.
This page was last updated on Wednesday, May 3, 2023 at 1:45 PM EDT.
Missions
This visualization is related to the following missions:Series
This visualization can be found in the following series:Datasets used in this visualization
-
CPC (Climate Prediction Center) Cloud Composite
ID: 600Global cloud cover from multiple satellites
See all pages that use this dataset -
[SES 14: GOLD]
ID: 1049Global-scale Observations of the Limb and Disk (GOLD) is an ultraviolet imaging spectrograph to measure temperatures and densities in the Earth's thermosphere & ionosphere.
See all pages that use this dataset
Note: While we identify the data sets used in these visualizations, we do not store any further details, nor the data sets themselves on our site.
Related
- ID: 13502
- ID: 4737
 Visualization
 - ID: 4617
 Visualization