The CME Heard 'Round the Solar System
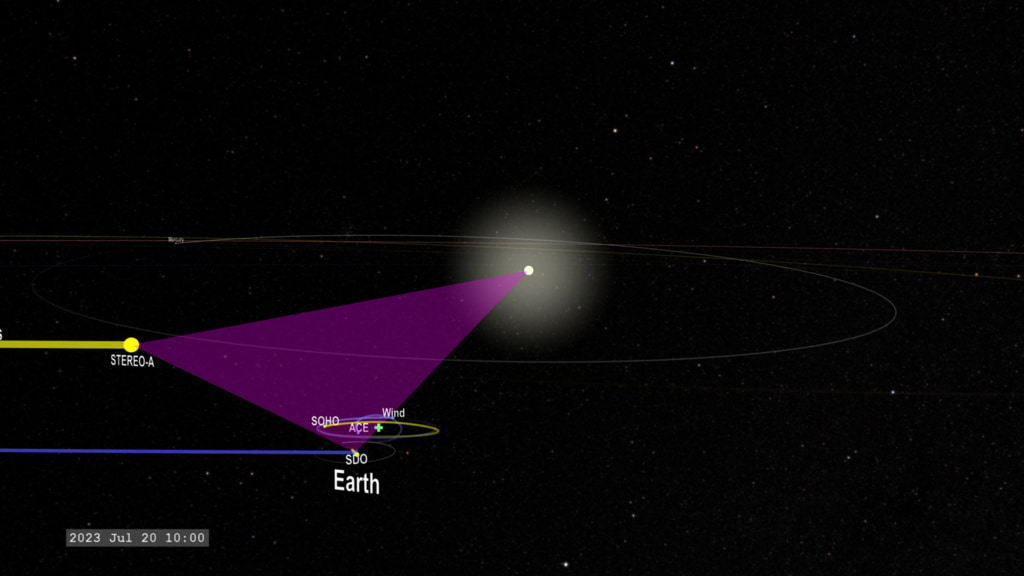
As the CMEs and SIRs move through the solar system, we include graphs of particle fluxes measured at Earth, Mars, and STEREO-A.
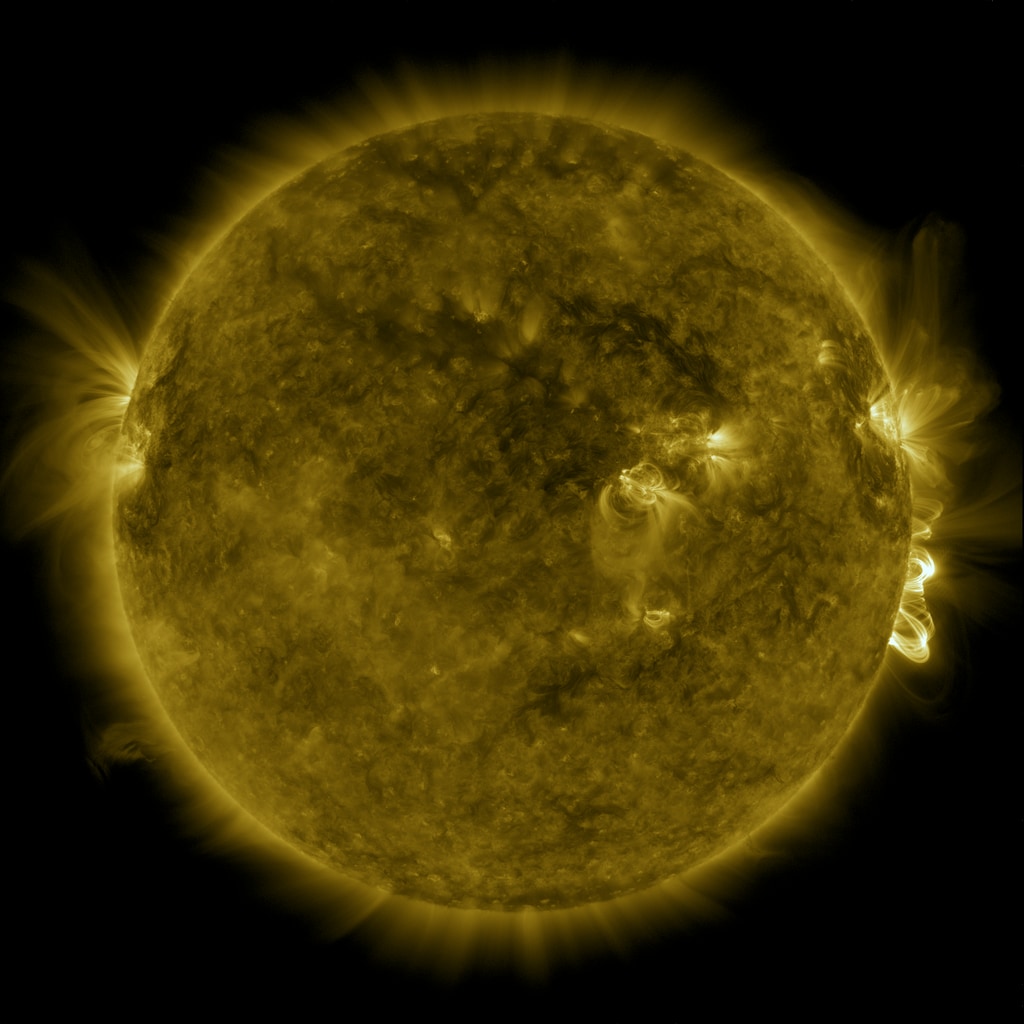
Energetic events at the Sun can reverberate around the solar system.
This visualization combines data from particle detectors around the solar system with an Enlil simulation of multiple coronal mass ejections (CMEs) in early September 2017. The Enlil model extends from 0.1 astronomical units (AUs) from the Sun (this is reponsible for the empty region around the Sun at the center of the system) out to 5 AUs.
Stream Interaction Regions (SIRs) are created by the interaction at boundaries between the fast and slow solar wind (usually defined by coronal holes). In this model, they are represented by blue spirals streaming out from the sun at the center.
Active Region 12673 erupted with several X-class flares and CMEs on September 9-10, 2017. The initial CME was slow (500 km/s) and the subsequent CMEs were faster (1000 km/s and 2600 km/s, respectively). Eventually the CMEs merged together and continued outward.
At Earth, the particle detector on GOES detects the initial flare. The energetic proton flux decays with time and has a sharper decrease as the CME and SIR pass Earth.
The initial flare is also detected at Mars by Mars EXpress, after which the flux declines. The flux experiences an additional sharp drop as the CME passes Mars.
There is a small flux increase at STEREO-A at the time of the flare. However, the flux increases dramatically as the SIR passes, then slowly decays.
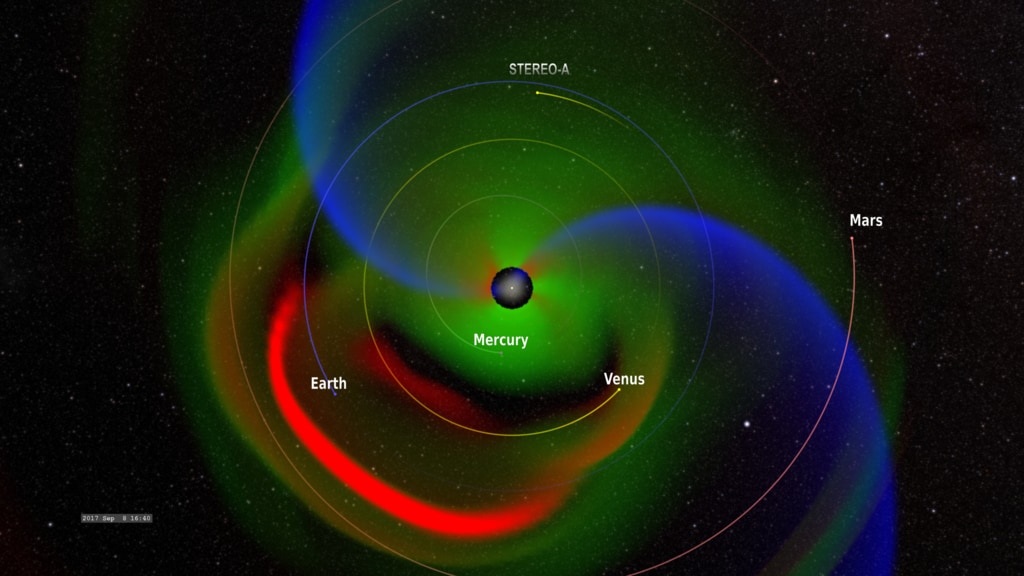
First frame of the visualization, illustrating regions of high temperature (red), high particle density (green), and the stream interaction region (SIR, blue).

Color bar representing changes in plasma density, in atomic mass units (AMU) per cubic centimeter. This is roughly equal to the number of hydrogen ions per cubic centimeter.
Color bar representing the plasma temperature.
Credits
Please give credit for this item to:
NASA's Goddard Space Flight Center Scientific Visualization Studio and the Community-Coordinated Modeling Center (CCMC), Enlil and Dusan Odstrcil (GMU).
-
Visualizer
- Tom Bridgman (Global Science and Technology, Inc.)
-
Scientist
- M. Leila Mays (NASA/GSFC)
-
Writer
- Mara Johnson-Groh (Wyle Information Systems)
-
Technical support
- Laurence Schuler (ADNET Systems, Inc.)
- Ian Jones (ADNET Systems, Inc.)
Release date
This page was originally published on Friday, November 30, 2018.
This page was last updated on Thursday, January 25, 2024 at 12:10 AM EST.
Missions
This visualization is related to the following missions:Series
This visualization can be found in the following series:Papers used in this visualization
Datasets used in this visualization
-
Enlil Heliospheric Model (Enlil Heliospheric Model)
ID: 685MHD solar wind simulation
See all pages that use this dataset -
[STEREO-A: High Energy Telescope (HET)]
ID: 1030This dataset can be found at: https://stereo.gsfc.nasa.gov
See all pages that use this dataset -
[Mars EXpress (MEX): ASPERA]
ID: 1031 -
[GOES: Energetic Particle Sensor (EPS)]
ID: 1032
Note: While we identify the data sets used in these visualizations, we do not store any further details, nor the data sets themselves on our site.
Related
- ID: 5136
 Visualization
 - ID: 4491
 Visualization
Used as a Source In
- ID: 13275
![Watch this video on the NASA Goddard YouTube channel.Complete transcript available.Music credits: “Boreal Moment” by Benoit Scarwell [SACEM]; “Sensory Questioning”, “Natural Time Cycles”, “Emerging Designer”, and “Experimental Design” by Laurent Dury [SACEM]; “Superluminal” by Lee Groves [PRS], Peter George Marett [PRS] from Killer Tracks](/vis/a010000/a013200/a013275/13275_AstronautRadiation_Twitter.01205_print.jpg) Produced Video
Produced Video