The Brown Ocean Effect
Before Tropical Storm Bill made landfall over Texas, eastern Texas experienced several days of rain that began flooding areas to the south east and northern parts of the state. As Tropical Storm Bill moved northward through Texas it is hypothesized that it fed off the highly saturated ground (as if it were still over the ocean) and can be seen slightly intensifying (via winds) as it moved into Oklahoma and progressed to the northeast.
In several regions of the world, tropical cyclones have been known to maintain or increase strength after landfall without transitioning to extratropical systems. It is hypothesized that these inland areas help sustain tropical cyclones when there has been plentiful rainfall, leading to unusually wet soil and strong latent heat release. Additionally, given the symmetric structure of warm-core cyclones, the atmosphere should tend toward barotropic conditions that mimic an ocean environment. Observational and modeling studies support this "brown ocean" concept, providing a global climatology of inland tropical cyclones, pinpointing regions that are more favorable for re-intensification, and analyzing individual cyclones to better understand the associated land-atmosphere feedbacks.

Color bar for liquid precipitation rates (ie, rain rates). Shades of green represent low amounts of liquid precipitation, whereas shades of red represent high amounts of precipitation.
Colorbar for soil moisture, where areas in red have little soil moisture and areas in blue are wet.
Colorbar for accumulated precipitation beginning June 16, 2016.
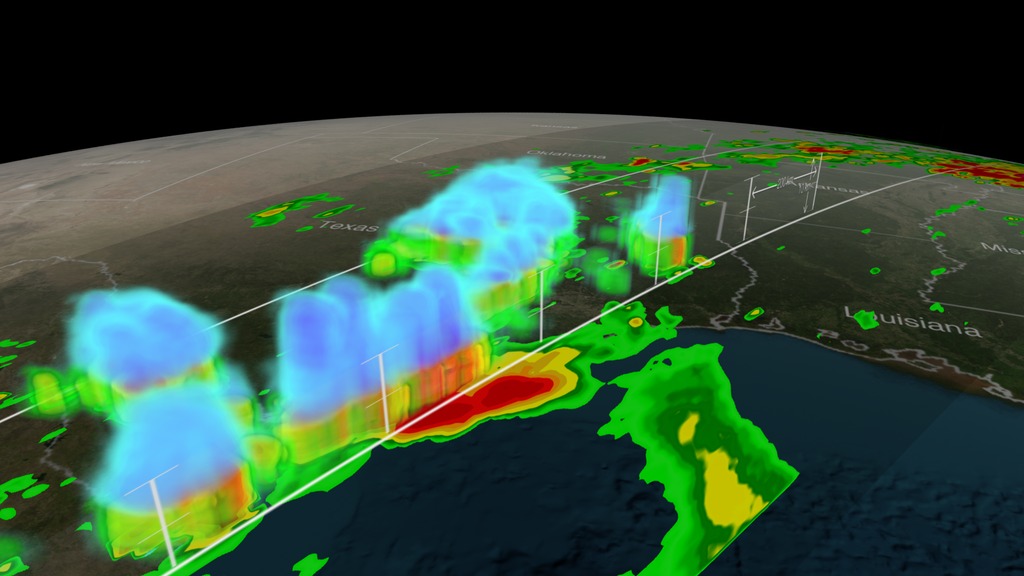
Print resolution still of Tropical Storm Bill on June 17, 2015 showing winds, IMERG precipitation, cloud cover, and soil moisture.
Print resolution image of Tropical Storm Bill on June 17, 2015 showing winds, accumulated precipitation (beginning on June 16, 2015 when it made landfall), and cloud cover.
Print resolution still showing the accumulated precipitation from Tropical Storm Bill from the time it made landfall on June 16, 2015 until June 19, 2015.
- Atmosphere
- Atmospheric science
- Climate Indicators
- Earth Science
- floods
- Human Dimensions
- Hydrology
- Hydrosphere
- Hyperwall
- IMERG
- Land Surface
- Land Surface/agriculture Indicators
- Natural hazards
- precipitation
- rain
- Rainfall
- soil moisture
- Soil Moisture/Water Content
- Soil science
- Soils
- surface water
- Terrestrial Hydrosphere
- Tropical Storm
Credits
Please give credit for this item to:
NASA's Scientific Visualization Studio
-
Data visualizers
- Alex Kekesi (Global Science and Technology, Inc.)
- Horace Mitchell (NASA/GSFC)
- Trent L. Schindler (USRA)
- Greg Shirah (NASA/GSFC)
-
Producer
- Matthew R. Radcliff (USRA)
-
Scientist
-
Researcher
- Theresa Andersen (University of Georgia)
-
Technical support
- Laurence Schuler (ADNET Systems, Inc.)
- Ian Jones (ADNET Systems, Inc.)
Release date
This page was originally published on Thursday, October 5, 2017.
This page was last updated on Wednesday, November 15, 2023 at 12:11 AM EST.
Series
This visualization can be found in the following series:Datasets used in this visualization
-
CPC (Climate Prediction Center) Cloud Composite
ID: 600Global cloud cover from multiple satellites
See all pages that use this dataset -
IMERG
ID: 863This dataset can be found at: http://pmm.nasa.gov/sites/default/files/document_files/IMERG_ATBD_V4.4.pdf
See all pages that use this dataset -
NASA-USDA-FAS Soil Moisture (Surface Soil Moisture corrected with SMOS imagery and assimilated by the Ensemble Kalman Filter)
ID: 954The surface soil moisture product is corrected by integrating satellite-derived Soil Moisture Ocean Salinity (SMOS) mission surface soil moisture retrievals into the modified Palmer two-layer soil moisture model. The SMOS imagery helps to correct the modified Pal
See all pages that use this dataset -
Winds [MERRA-2]
ID: 959
Note: While we identify the data sets used in these visualizations, we do not store any further details, nor the data sets themselves on our site.
Related
- ID: 11904
 Produced Video
 - ID: 4316
 Visualization