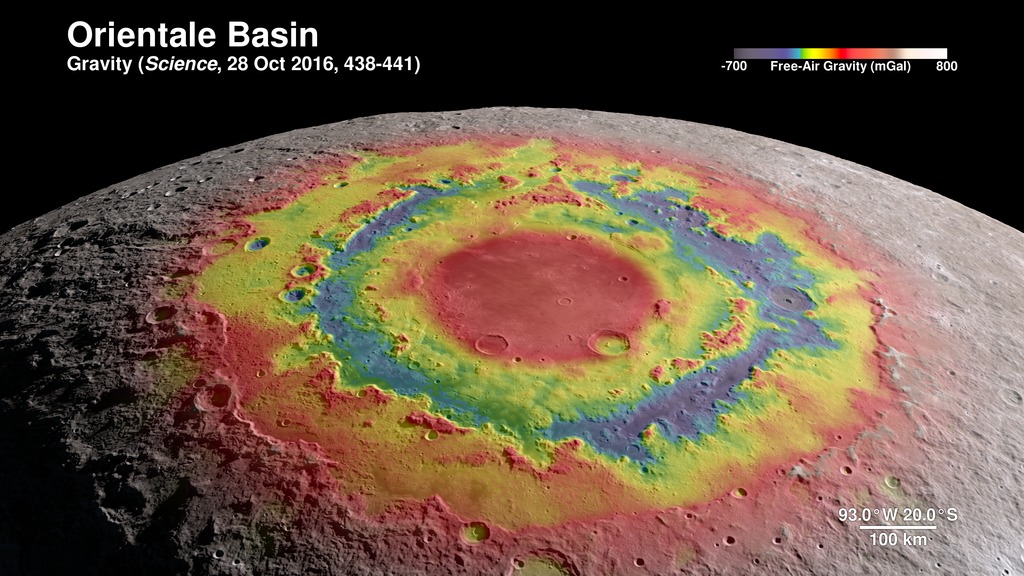
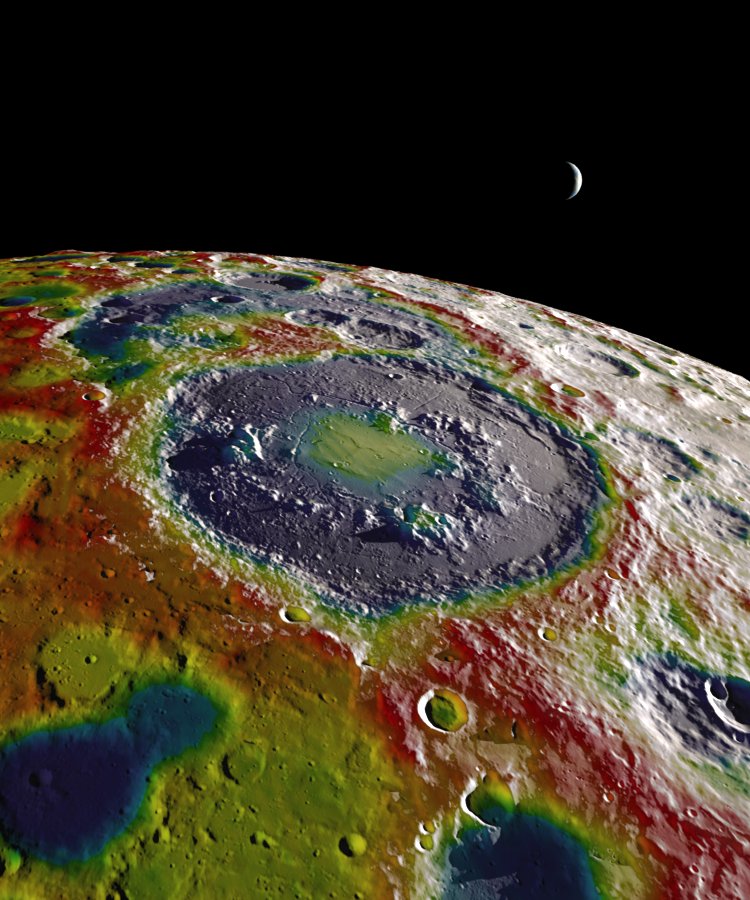
Orientale Impact Basin for the Cover of Science
This print-resolution still image was created for the cover of the October 28, 2016 issue of Science. It features a free-air gravity map of the Orientale impact basin based on data returned by the Gravity Recovery and Interior Laboratory (GRAIL) mission.
Orientale is about 930 kilometers wide and lies on the western limb of the Moon as viewed from Earth. It's the Moon's youngest and best-preserved large impact basin, formed about 3.8 billion years ago at the end of the conjectured Late Heavy Bombardment. A paper in Science by Maria Zuber et al. uses the GRAIL data to shed new light on the basin's geology, while a second paper by Brandon Johnson et al. describes a computer simulation of the basin's formation constrained by that data.
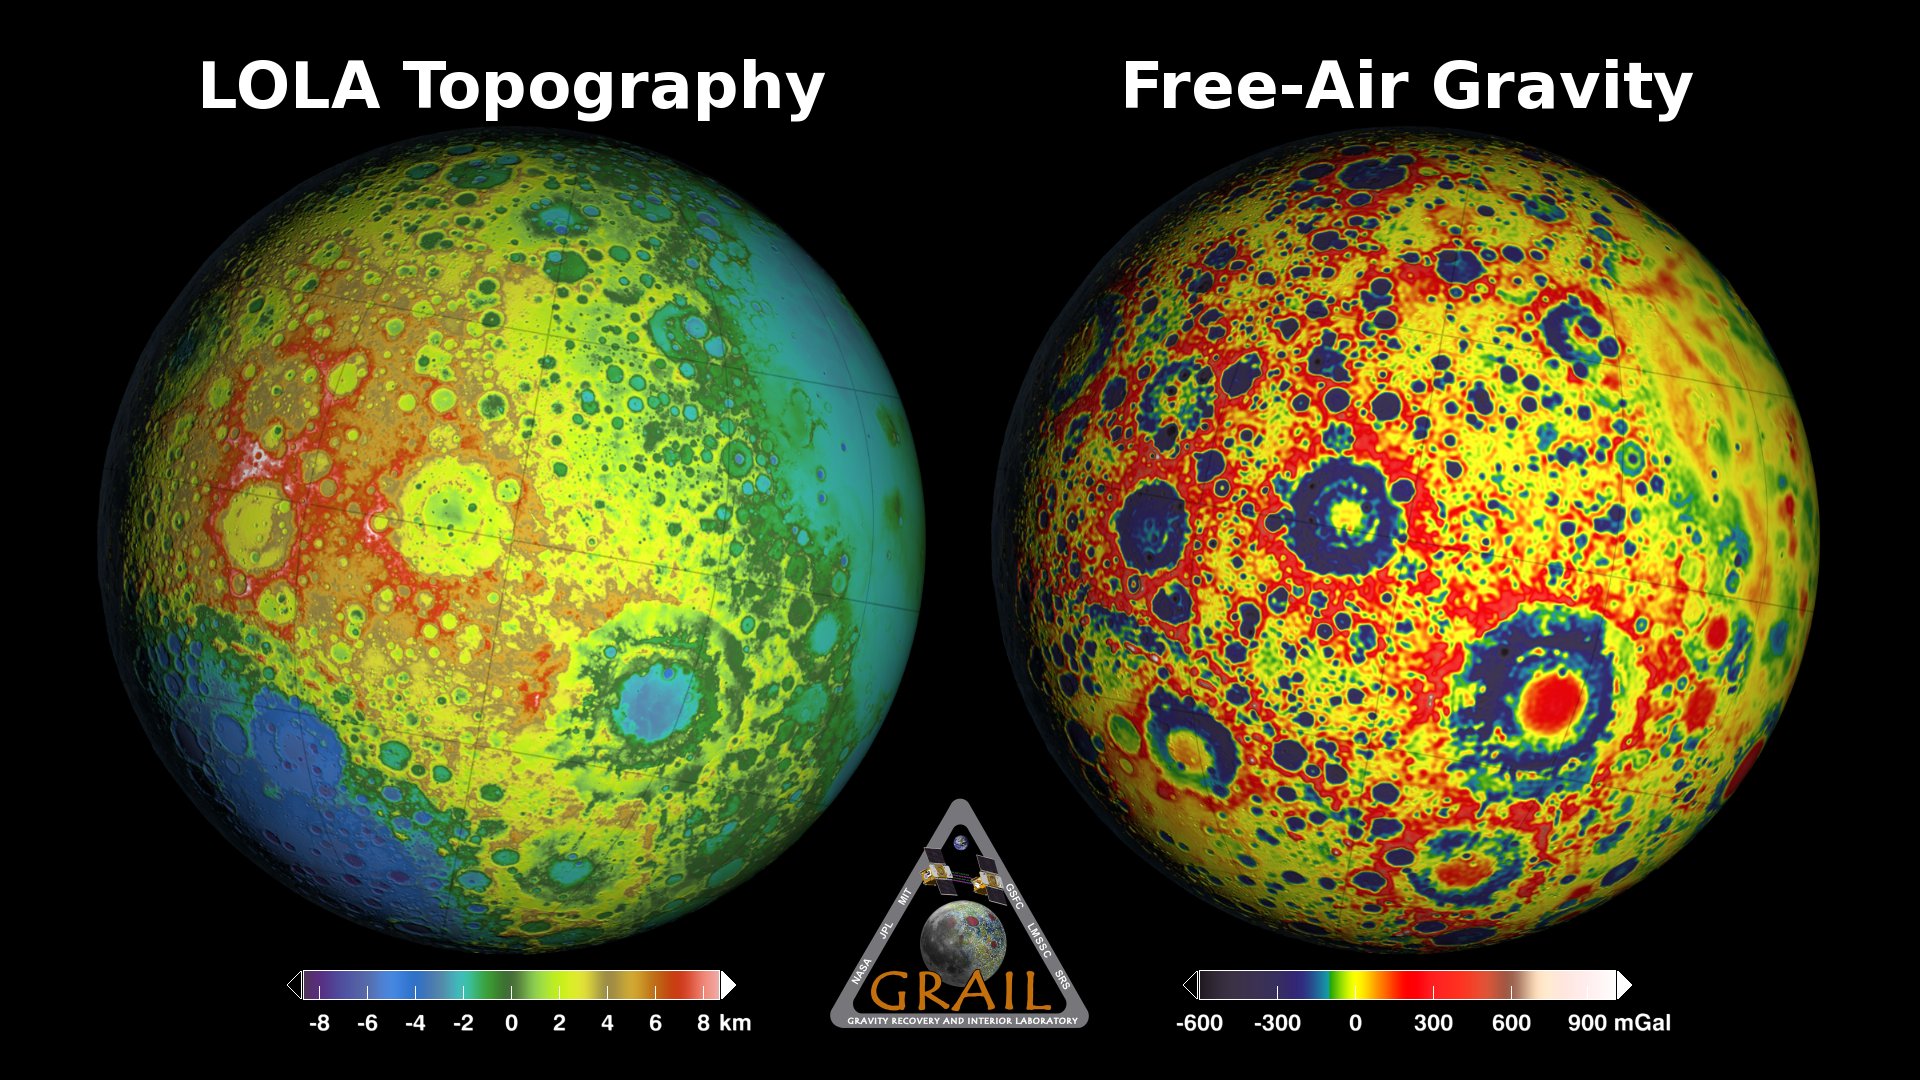
The shaded relief in this image is not a photograph. It's a very accurate computer rendering based on a digital model of the terrain. The model is derived from a digital elevation map called SLDEM2015. This map combines data from the laser altimeter (LOLA) on NASA's Lunar Reconnaissance Orbiter (LRO) with stereo imagery from the Terrain Camera on the Japan Space Agency's SELENE spacecraft.
The angle of the virtual Sun was chosen to throw Orientale's terrain into high relief — it's just after sunrise at Orientale, about a day past full Moon. The camera is on the western terminator (day/night line) looking north.
The colorful part is the gravity anomaly based on measurements by GRAIL. Red indicates areas of higher gravity, or excess mass, and blue indicates lower gravity or areas of mass deficits. The GRAIL data reveals the structure of the basin beneath the surface. The red in the center of the basin, for example, shows that the crust is particularly thin there, and that denser mantle material is closer to the surface.

The Orientale impact basin, combining shaded relief with free air gravity.
Credits
Please give credit for this item to:
NASA's Scientific Visualization Studio
-
Visualizer
- Ernie Wright (USRA)
-
Scientists
- Gregory A. Neumann (NASA/GSFC)
- Maria Zuber (Massachusetts Institute of Technology)
Release date
This page was originally published on Friday, October 21, 2016.
This page was last updated on Wednesday, May 3, 2023 at 1:48 PM EDT.
Missions
This visualization is related to the following missions:Series
This visualization can be found in the following series:Papers used in this visualization
M. Zuber et al., Gravity field of the Orientale basin from the Gravity Recovery and Interior Laboratory Mission, Science, 28 Oct 2016: 438-441
Datasets used in this visualization
-
SLDEM2015 (DIgital Elevation Model) [LRO/SELENE: LOLA/TC]
ID: 948A digital elevation model of the Moon derived from the Lunar Orbiter Laser Altimeter and the SELENE Terrain Camera. See the description in Icarus. The data is here.
See all pages that use this dataset
Note: While we identify the data sets used in these visualizations, we do not store any further details, nor the data sets themselves on our site.
Related
- ID: 4619
 Visualization
 - ID: 4175
- ID: 4014
 Visualization