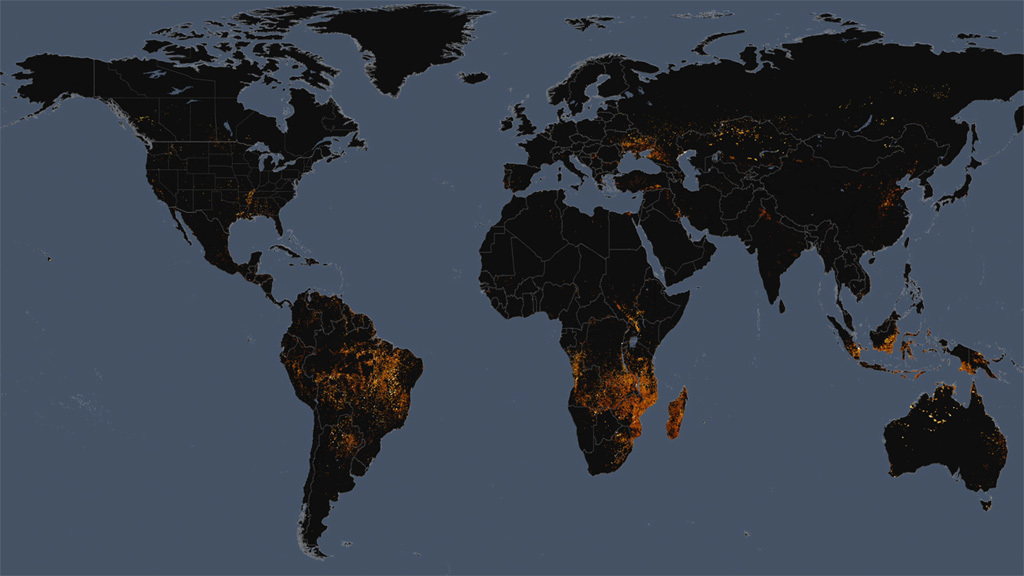
Global Fires 2015-2016 Visualizations
Global Fires 2015-2016, with Dates and Colorbar
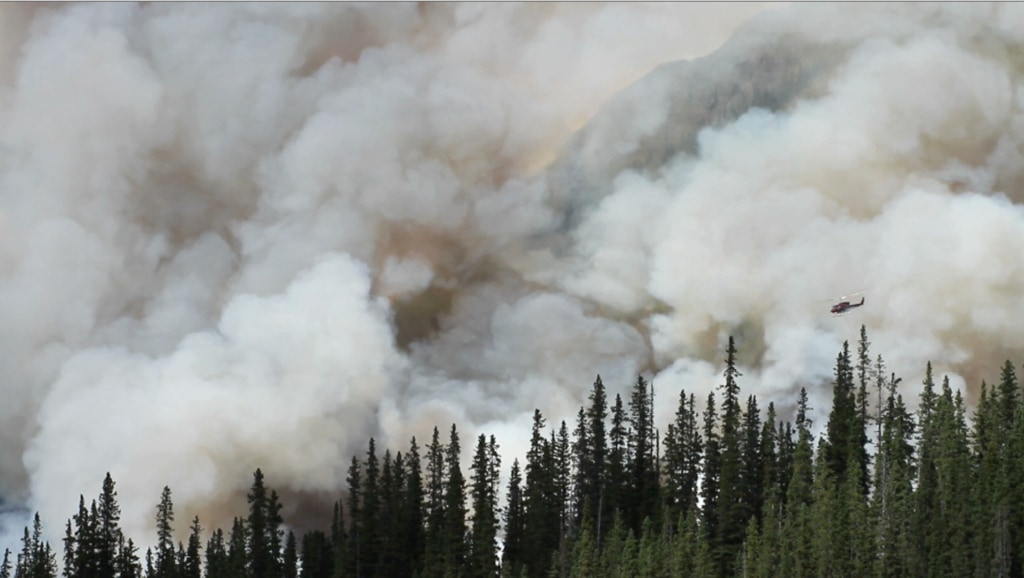
The 2016 wildfire season is off to a blazing start. To date, more than 29,000 wildfires have burned over 2.6 million acres in the United States alone. In other parts of the world, hot and dry conditions fueled by El Niño have primed places like the southern Amazon for heavy wildfire activity. Scientists say the region is the driest it’s been in more than a decade. Using data collected by satellites, NASA monitors fires across the globe. The space-based views of actively burning fires help fire managers on the ground locate potentially hazardous blazes. The observations also aid researchers in tracking the spread of smoke and ash from fires, which can significantly impact air quality. Watch the video to see a data visualization showing fires detected from space over the course of a year.
These visualizations were created for July 28, 2016 live shots and interviews.
Global Fires 2015-2016, with Dates
Global Fires 2015-2016

Dates

Colorbar
Credits
Please give credit for this item to:
NASA's Scientific Visualization Studio
-
Visualizers
- Trent L. Schindler (USRA)
- Lori Perkins (NASA/GSFC)
-
Producers
- Claire Saravia (NASA/GSFC)
- Matthew R. Radcliff (USRA)
- Patrick Lynch (Wyle Information Systems)
Release date
This page was originally published on Tuesday, August 16, 2016.
This page was last updated on Tuesday, November 14, 2023 at 12:08 AM EST.
Missions
This visualization is related to the following missions:Datasets used in this visualization
-
Active Fires from MODIS and VIIRS
ID: 955The active fires data is a combined data product using Terra and Aqua's MODIS data and NOAA's NPP VIIRS 375m data.
See all pages that use this dataset
Note: While we identify the data sets used in these visualizations, we do not store any further details, nor the data sets themselves on our site.
Used as a Source In
- ID: 12667
 Produced Video
 - ID: 12344
 Produced Video