Arctic Sea Ice from March to September 2017
In this visualization, the daily Arctic sea ice and seasonal land cover change progress through time, from this year’s wintertime maximum extent on March 7, 2017, through September 13, 2017 when the sea ice reached its annual minimum extent for the year. Over the water, Arctic sea ice changes from day to day showing a running 3-day minimum sea ice concentration in the region where the concentration is greater than 15%. The blueish white color of the sea ice is derived from a 3-day running minimum of the AMSR2 89 GHz brightness temperature. Over the terrain, monthly data from the seasonal Blue Marble Next Generation fades slowly from month to month.
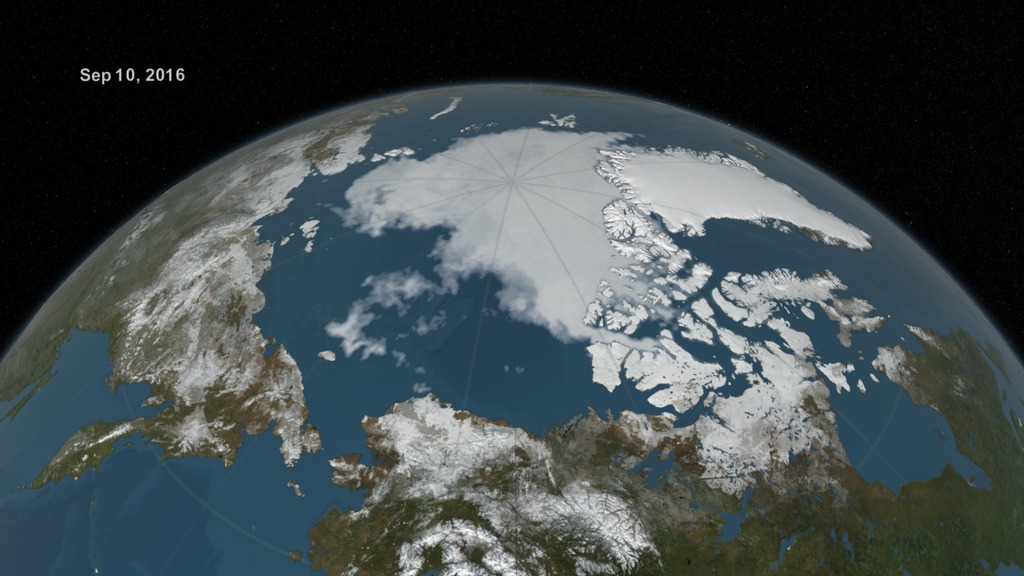
Arctic sea ice appears to have reached its yearly summertime minimum extent for 2017, according to scientists at the NASA-supported National Snow and Ice Data Center (NSIDC) in Boulder, Colo. Observations indicate that on September 13th, ice extent shrunk to the eighth lowest minimum extent in the satellite record, at 4.64 million sq km, or 1.79 million sq mi.

This image shows the Arctic sea ice on September 13, 2017 when the ice reached its minimum extent. The opacity of the sea ice is derived from the sea ice concentration where it is greater than 15%. The blueish white color of the sea ice is derived the AMSR2 89 GHz brightness temperature. The Japan Aerospace Exploration Agency (JAXA) provides many water-related products derived from data acquired by the Advanced Microwave Scanning Radiometer 2 (AMSR2) instrument aboard the Global Change Observation Mission 1st-Water "SHIZUKU" (GCOM-W1) satellite. Two JAXA datasets used in these visuals are the 10-km daily sea ice concentration and the 10 km daily 89 GHz Brightness Temperature.
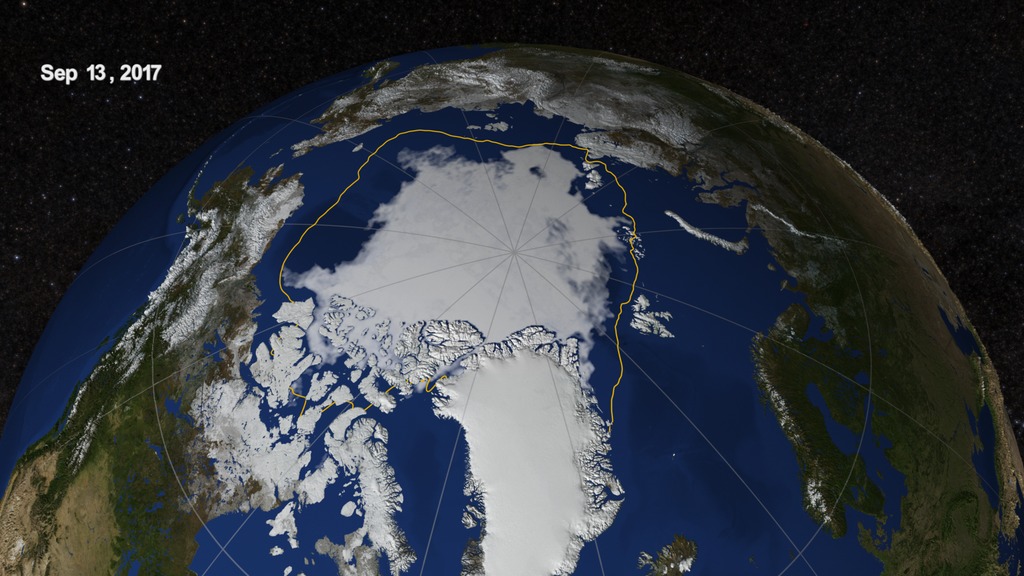
A still image of the Arctic sea ice on September 13, 2017, when the ice reached its annual minimum. In addition, a yellow line marks the 30-year average minimum sea ice extent computed over the time period from 1981 through 2010.
Credits
Please give credit for this item to:
NASA's Scientific Visualization Studio
-
Visualizers
- Helen-Nicole Kostis (USRA)
- Cindy Starr (Global Science and Technology, Inc.)
- Greg Shirah (NASA/GSFC)
-
Scientist
- Claire Parkinson (NASA/GSFC)
-
Producer
- Jefferson Beck (USRA)
-
Writer
- Maria-Jose Vinas Garcia (Telophase)
-
Technical support
- Laurence Schuler (ADNET Systems, Inc.)
- Ian Jones (ADNET Systems, Inc.)
Release date
This page was originally published on Tuesday, September 19, 2017.
This page was last updated on Wednesday, November 15, 2023 at 12:09 AM EST.
Datasets used in this visualization
-
10 km Daily Sea Ice Concentration [SHIZUKU (GCOM-W1): AMSR2]
ID: 795Credit: AMSR2 data courtesy of the Japan Aerospace Exploration Agency (JAXA).
See all pages that use this dataset -
10 km Daily 89 GHz Brightness Temperature [SHIZUKU (GCOM-W1): AMSR2]
ID: 796Credit: AMSR2 data courtesy of the Japan Aerospace Exploration Agency (JAXA).
See all pages that use this dataset
Note: While we identify the data sets used in these visualizations, we do not store any further details, nor the data sets themselves on our site.
Related
- ID: 13075
![Music: Haunting Memories by Emmanuel David Lipszyc [SACEM], Franck Lascombes [SACEM], Sébastien Lipszyc [SACEM]Complete transcript available.](/vis/a010000/a013000/a013075/sea_ice_min_w_avg_print_res_print.jpg)
- ID: 4494
 Visualization
Used as a Source In
- ID: 12984
 Produced Video
 - ID: 12734
 Produced Video