IMERG Rainfall Accumulation over the United States for December 2015
A series of winter storms brought more than 20 inches of rainfall to the Midwest and southeastern United States in December 2015. Massive flooding followed throughout both the regions.
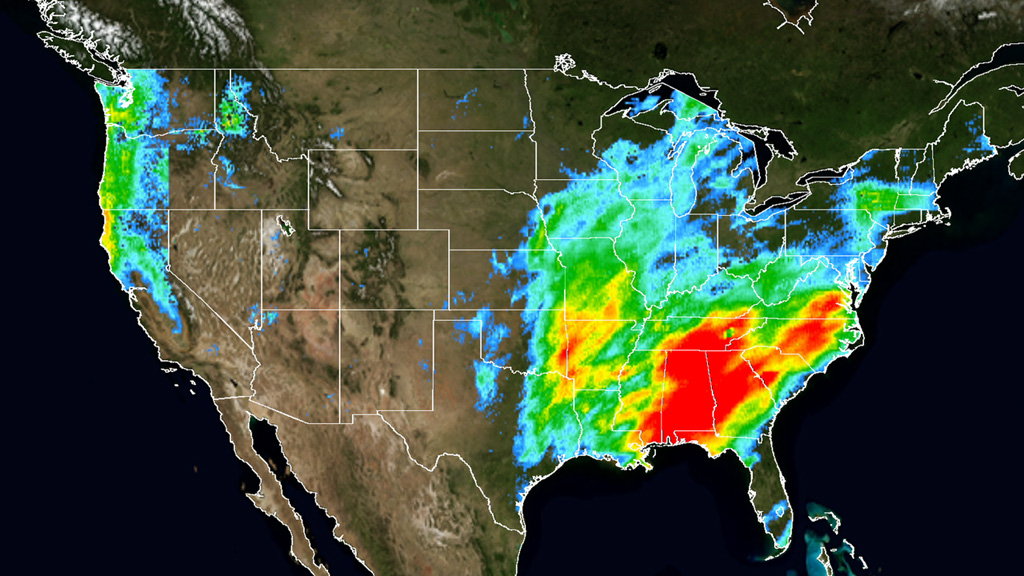
This animation shows the accumulation of rainfall from December's three major storm systems that took place on Dec. 1 through 3, Dec. 13 through 16, and Dec. 21 through 31. The observations are from NASA's Global Precipitation Measurement (GPM) mission. Red colors indicate accumulate rainfall of 20 inches, yellow show 10-12 inches, green 6-10 inches, and shades of blue 2-6 inches. The extent of the area that drains into the Mississippi River is outlined in black.
In the Midwest, rainwater swelled the banks of rivers and tributaries that then feed the Mississippi River, leading to flooding in Missouri, Illinois, Oklahoma, Arkansas and Mississippi. The crest of the Mississippi River travelled downstream through Louisiana toward the Gulf of Mexico the first week of January 2016, passing through New Orleans, which opened the Bonnet Carre Spillway north of the city to prevent flooding.
Alabama and Georgia and other areas in the southeast were hardest hit by rainstorms that arrived Christmas week, which led to massive flooding and declarations of a state of emergency in Alabama and northern Georgia.
This animation shows the accumulation of rainfall over the United States during December 2015, from the IMERG precipitation dataset. The black outline indicates the Mississippi-Missouri River basin. This version has been edited to only show the periods of significant rainfall during the month.
This video is also available on our YouTube channel.
This animation shows the accumulation of rainfall over the United States during December 2015, from the IMERG precipitation dataset. This version shows the entire month.
Credits
Please give credit for this item to:
NASA's Scientific Visualization Studio
-
Visualizer
- Horace Mitchell (NASA/GSFC)
-
Scientist
- George Huffman (NASA/GSFC)
-
Writer
- Ellen T. Gray (ADNET Systems, Inc.)
Release date
This page was originally published on Thursday, January 14, 2016.
This page was last updated on Tuesday, November 14, 2023 at 12:07 AM EST.
Missions
This visualization is related to the following missions:Datasets used in this visualization
-
IMERG
ID: 863This dataset can be found at: http://pmm.nasa.gov/sites/default/files/document_files/IMERG_ATBD_V4.4.pdf
See all pages that use this dataset
Note: While we identify the data sets used in these visualizations, we do not store any further details, nor the data sets themselves on our site.
Used as a Source In
- ID: 12129
 Produced Video