A Year of Global Carbon Dioxide Measurements
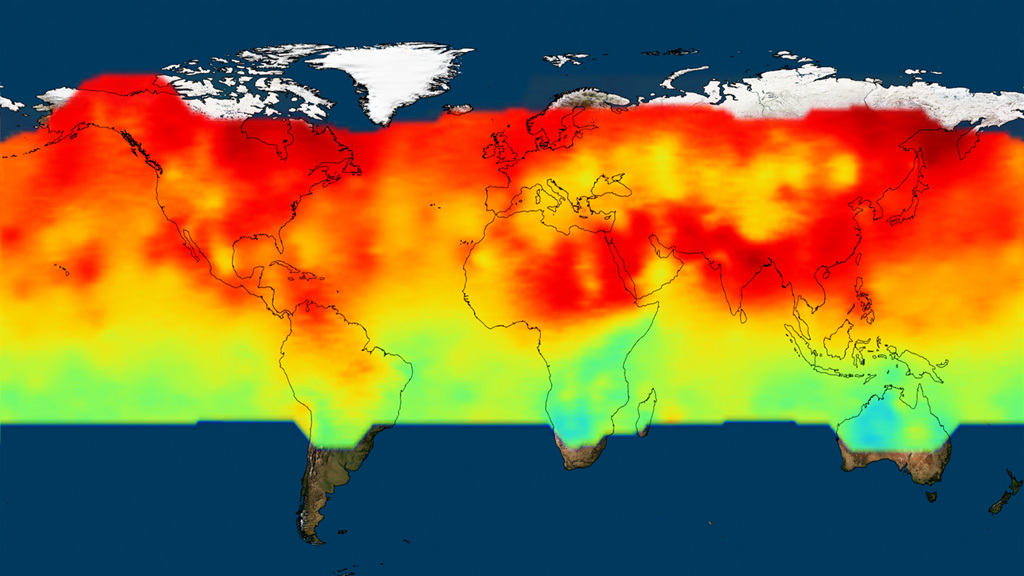
Mollweide projected animation of CO2 data from the OCO-2 mission. Data spans from September 2014 to August 2015. As the data cycles through the year, you can see an increase CO2 concentrations across the northern hemisphere going from winter to spring. Then in the summer, as vegetation reaches it's peak, there is a noticeable decline in CO2 concentration throughout the entire northern hemisphere.
Carbon dioxide is vital for life on Earth, but an overload of the greenhouse gas is driving one of the most serious problems facing our planet: climate change. With NASA's new experimental satellite, the Orbiting Carbon Observatory-2 (OCO-2) scientists now have a more complete picture of how Earth is changing as carbon dioxide levels rise.

Colorbar for Carbon Dioxide (CO2) measured in parts per million (ppm). Shades of red are higher amounts, whereas shades of blue are lower.
Platte Carre projected animation of CO2 data from the OCO-2 mission. Data spans from September 2014 to August 2015.

Frame sequence of corresponding dates to overlay atop OCO-2 visualization.
Credits
Please give credit for this item to:
NASA's Scientific Visualization Studio
-
Visualizers
- Alex Kekesi (Global Science and Technology, Inc.)
- Greg Shirah (NASA/GSFC)
-
Producers
- Michelle Handleman (USRA)
- Wade Sisler (NASA/GSFC)
- Matthew R. Radcliff (USRA)
-
Support
- Horace Mitchell (NASA/GSFC)
-
Scientist
- Annmarie Eldering (NASA/JPL CalTech)
Release date
This page was originally published on Thursday, November 19, 2015.
This page was last updated on Tuesday, November 14, 2023 at 12:07 AM EST.
Missions
This visualization is related to the following missions:Datasets used in this visualization
-
OCO-2 (Carbon Dioxide) [Orbiting Carbon Observatory-2: OCO-2]
ID: 902
Note: While we identify the data sets used in these visualizations, we do not store any further details, nor the data sets themselves on our site.
Related
- ID: 12072
 Produced Video
 - ID: 12057
 Produced Video