Making Video Games for NASA
This gallery was created for Earth Science Week 2015 and beyond. It includes a quick start guide for educators and first-hand stories (blogs) for learners of all ages by NASA visualizers, scientists and educators. We hope that your understanding and use of NASA's visualizations will only increase as your appreciation grows for the beauty of the science they portray, and the communicative power they hold. Read all the blogs and find educational resources for all ages at: the Earth Science Week 2015 page.
How would you like to fly alongside a NASA satellite and see the Earth as the satellite's instruments see it? You can, with a free app called NASA's Eyes on the Earth. It includes NASA's entire fleet of Earth-observing satellites. Ride along virtually with any of them in real time or at super-speed.

Two images from Eyes on the Earth: Gravity field is on the left, sea level is on the right. The user can rotate the planet to any desired location, zoom in and out, see NASA's entire fleet of Earth-observing satellites, set the speed with which time passes and select many different kinds of displays.
You can see where the satellites are or will be. And you can change the image of the Earth below from what you would see with your eyes to a display of what the orbiting instruments are telling us. For example, you can see temperatures throughout the world, sea level in different parts of the ocean or variations in Earth's gravity field. And there are many other options, too.
And here's the important thing: You're not looking at an "artist’s impression." Along with actual images from space, you're getting real satellite data that has been translated into pictures that show you what the data means. In some cases, the displays are updated as little as an hour after the measurements are beamed to Earth.
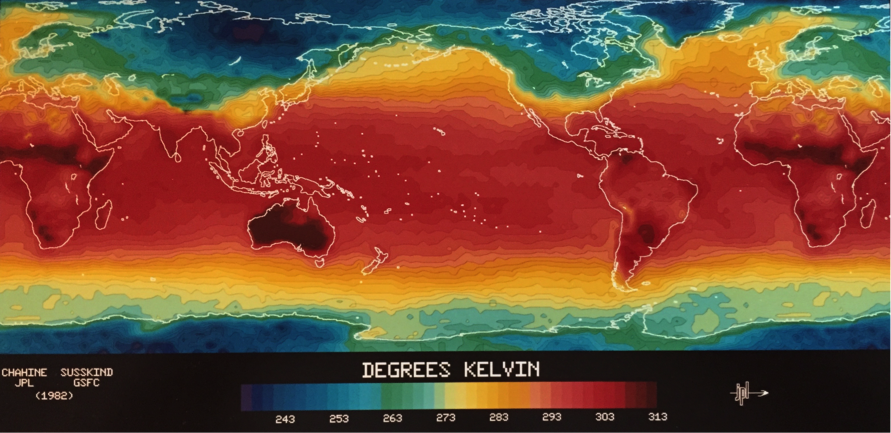
This image, from January 1979, is the very first global map of the air temperature at Earth's surface that was based on data from a satellite.

Air temperature at Earth's surface as viewed on NASA's Eyes on the Earth app on October 5, 2015. Users can rotate the planet to see the temperature anywhere on the planet.
Eyes on the Earth is an example of an interactive visualization. A visualization is a graphic representation of actual data. An interactive visualization is one that you can play like a video game. In fact, Eyes on the Earth uses the same game engine as Kirbal Space Program, Lara Croft: Relic Run, and many other popular games.
And I'm proud to say that I lead the team at JPL that created this app and its two sister apps: Eyes on the Solar System lets you fly anywhere you like in our solar system and even beyond, to see how it really is/was/will be from 1950 to 2050. And Eyes on Exoplanets, lets you explore actual solar systems in other parts of the galaxy.
Fully a third of the visualizations we create at JPL are for Earth Science. Visualizations are a great way to give the general pubic a feel for what NASA scientists and engineers are doing. And they actually help the scientists and engineers, themselves, get a handle on the vast amounts of data that their work produces. We also use visualizations to help lawmakers make informed decisions about environmental policies and NASA programs.

This map of the Arctic region in June, 2014, was produced by a colleague with data from the Atmospheric Infrared Sounder (AIRS) instrument onboard NASA's Aqua satellite. It shows where moisture was evaporating (orange and red) or precipitating (blue.) This information helps scientists understand how the decline in sea ice is contributing to a warmer, wetter Arctic.
For more information on this map, click here.

Even without the waves, the ocean surface is not flat all over. This map, on display at the Smithsonian National Air and Space Museum in Washington, DC, shows where the water is higher (lighter shades) or lower (darker), depending on whether mountains or trenches lie below. It was made with data from the Seasat satellite in 1979. The brown cutouts are land.
If you're thinking that I have the greatest job in the world, I totally agree! And now, I'm going to tell you the secret to getting a job that you will enjoy as much as I enjoy mine.
First, as you might guess, find something you love and do whatever it takes to excel at it. Then, develop some additional, complementary skills that set you apart from the competition. If science is your thing, for example, develop skills that help you communicate your science.
If you love biology, be a terrific biology student (obviously.) But also take up video game programming and make a biology game. Or learn how to use Photoshop really well and create drawings and animations of biological phenomena.
In my case, I loved making maps as a kid. So I majored in geography in college, a field that includes mapmaking. My cartography class was like playtime to me.
Then I took the advice of one of my professors and learned how to program computers. That was unusual for geography students back then, but it became a valuable bonus skill I could offer employers. It was something to distinguish me from all the other good geography students.
Look for opportunities, or create opportunities, to practice and hone your skills. I did special projects for my geography professors, like making graphs and maps — things that other kids weren't doing. I was learning and using geography plus a little bit of computer science, statistics and math.
Being an excellent geography student with those extra skills got me my first job at JPL. And my JPL work got me some side assignments doing special effects for IMAX movies and ultimately a job at Walt Disney Animation Studios. At Disney, I was a technology manager on The Hunchback of Notre Dame and nine other animated features. And I brought what I learned there back to JPL when I returned to take the job I have now. You just never know where fate might take you, especially if you have useful skills that the next guy doesn’t have and you keep on learning new ones.
One of the best people I ever hired for my visualization team was an aeronautical engineer who made a couple of video games in high school — some crazy tanks driving around, shooting each other. I thought, "This shows initiative, aptitude and desire." And I knew I wouldn't have to teach him the fundamentals of game programming, which is basically what we do here. His resume went to the top of the pile.
Here's another tip: If you can come up with novel uses for existing tools, you'll be a giant leap ahead. In fact, I would say that taking tools that other people have built and using them in ways that no one has thought of has made my career.
Maybe you'll think of innovative ways to use virtual reality systems or 3D printers or something I can't even imagine. Who knows? Surprise me!
Then you'll be on your way to getting what you will consider the greatest job in the world, just like I think of mine.
-- Kevin Hussey, Manager of the Visualization Technology Applications and Development Group (NASA, Jet Propulsion Laboratory)

In addition to working at NASA's JPL, Kevin Hussey has served as a technology manager at Walt Disney Feature Animation and as consultant to a wide variety of organizations including the FBI, Nuclear Regulatory Commission, National Archives and Department of Defense. If his three grandkids are very good, he may let them ride his motorcycle someday.
For More Information
Credits
Please give credit for this item to:
NASA's Scientific Visualization Studio
-
Author
- Kevin Hussey (NASA/JPL CalTech)
-
Project support
- Leann Johnson (Global Science and Technology, Inc.)
Release date
This page was originally published on Friday, October 9, 2015.
This page was last updated on Wednesday, May 3, 2023 at 1:49 PM EDT.