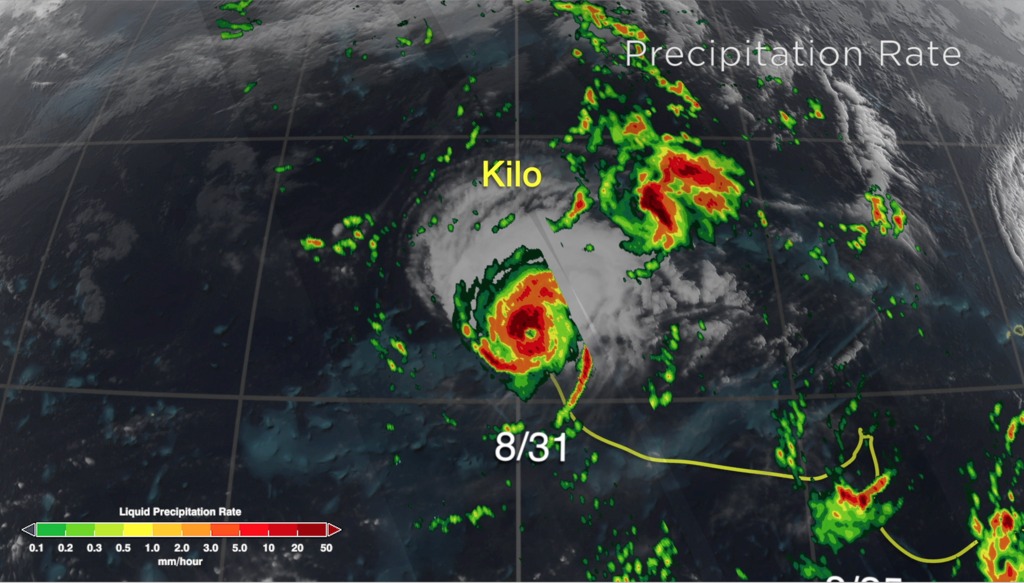
Hurricane Kilo's Precipitation Trail
Global view of Hurricane Kilo crossing the Pacific as it leaves an accumulated precipitation trail behind it.
NASA's Global Precipitation Measurement (GPM) mission's core observatory launched on Feb. 27, 2014 as a collaboration between NASA and the Japan Aerospace Exploration Agency and acts as the standard to unify precipitation measurements from a network of 12 satellites. The result is NASA's Integrated Multi-satellitE Retrievals for GPM data product, called, IMERG, which combines data from 12 satellites into a single seamless global precipitation map. The map covers more of the globe than any previous precipitation data set and is updated every half hour, allowing scientists to see how rain and snow storms move around nearly the entire planet. As scientists work to understand all the elements of Earth's climate and weather systems, and how they could change in the future, GPM provides a major step forward in providing the scientific community comprehensive and consistent measurements of precipitation.
Close up animation of Hurricane Kilo as it crosses the Pacific Ocean leaving a trail of precipitation behind it.

Colorbar for Kilo's accumulated precipitation. Cool colors (blue to green) represent smaller amounts of precipitation, whereas warmer colors (red through purple and on up to white) represent large amounts.
For More Information
Credits
Please give credit for this item to:
NASA's Scientific Visualization Studio Data provided by the joint NASA/JAXA GPM mission.
-
Visualizers
- Alex Kekesi (Global Science and Technology, Inc.)
- Greg Shirah (NASA/GSFC)
-
Scientists
- Gail Skofronick Jackson (NASA/GSFC)
- George Huffman (NASA/GSFC)
- Dalia B Kirschbaum (NASA/GSFC)
-
Producers
- Ryan Fitzgibbons (USRA)
- Rani Gran (NASA/GSFC)
Release date
This page was originally published on Thursday, September 17, 2015.
This page was last updated on Wednesday, May 3, 2023 at 1:49 PM EDT.
Missions
This visualization is related to the following missions:Series
This visualization can be found in the following series:Datasets used in this visualization
-
CPC (Climate Prediction Center) Cloud Composite
ID: 600Global cloud cover from multiple satellites
See all pages that use this dataset -
IMERG
ID: 863This dataset can be found at: http://pmm.nasa.gov/sites/default/files/document_files/IMERG_ATBD_V4.4.pdf
See all pages that use this dataset
Note: While we identify the data sets used in these visualizations, we do not store any further details, nor the data sets themselves on our site.
Related
- ID: 12007
 Produced Video