Tracking Kilo from Hurricane to Typhoon
Global visualization of Hurricane Kilo as it formed in the Eastern Pacific and moved across the international dateline finally diminishing in the Western Pacific near Japan. As Kilo progresses, GPM captures swathes of surface precipitation data throughout the storm's life cycle.
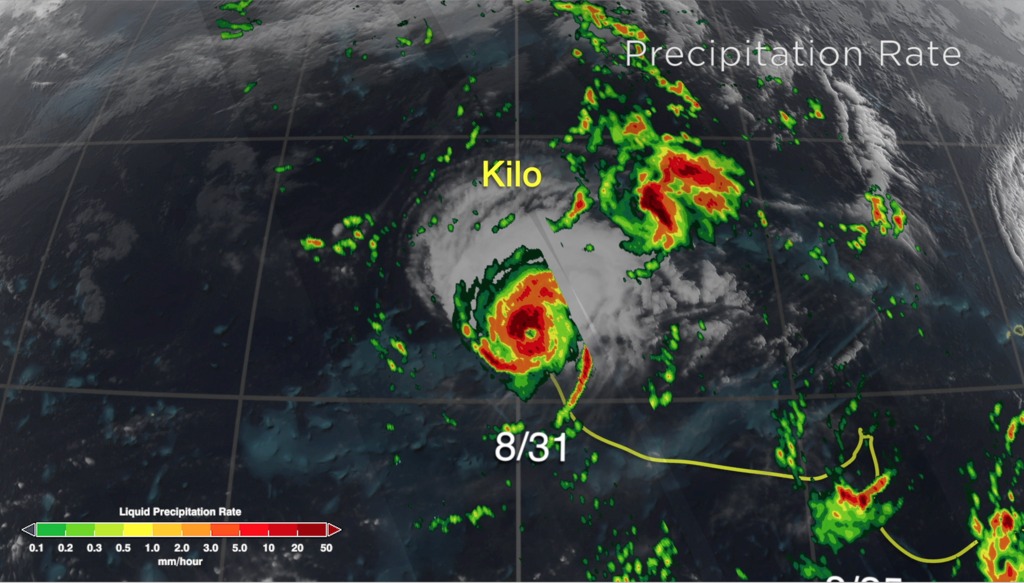
The Global Precipitation Measurement (GPM) mission's core satellite captured Hurricane Kilo throughout its life cycle as Kilo slowly worked it's way westward across the Pacific Ocean. Kilo eventually crossed the international dateline where it officially changed from a "hurricane" to a "typhoon". Along it's way, Kilo put itself in the record books. Kilo was the 3rd named storm of the 2015 hurricane season to cross the international dateline. It was also a very long lasting storm persisting for 21 days, which made it a fairly rare event. Because it was such a long lasting storm, GPM was able to capture it several times throughout the course of it's life span. Such multiple captures of the same storm can help scientists better understand the development of hurricanes.
Close up animation of Hurricane Kilo as it moves from the Eastern Pacific to the Western Pacific, while GPM occassionally passes overhead capturing snapshots of surface precipitation as the storm evolves.

Color bar for liquid precipitation rates (ie, rain rates). Shades of green represent low amounts of liquid precipitation, whereas shades of red represent high amounts of precipitation.
For More Information
Credits
Please give credit for this item to:
NASA's Scientific Visualization Studio
-
Visualizers
- Alex Kekesi (Global Science and Technology, Inc.)
- Greg Shirah (NASA/GSFC)
-
Scientists
- Gail Skofronick Jackson (NASA/GSFC)
- George Huffman (NASA/GSFC)
- Dalia B Kirschbaum (NASA/GSFC)
-
Producers
- Ryan Fitzgibbons (USRA)
- Rani Gran (NASA/GSFC)
Release date
This page was originally published on Thursday, September 17, 2015.
This page was last updated on Wednesday, May 3, 2023 at 1:49 PM EDT.
Missions
This visualization is related to the following missions:Series
This visualization can be found in the following series:Datasets used in this visualization
-
CPC (Climate Prediction Center) Cloud Composite
ID: 600Global cloud cover from multiple satellites
See all pages that use this dataset -
Rain Rates (Surface Precipitation) [GPM: GMI]
ID: 822Credit: Data provided by the joint NASA/JAXA GPM mission.
See all pages that use this dataset
Note: While we identify the data sets used in these visualizations, we do not store any further details, nor the data sets themselves on our site.
Related
- ID: 12007
 Produced Video