The Multiple CMEs of June, 2015
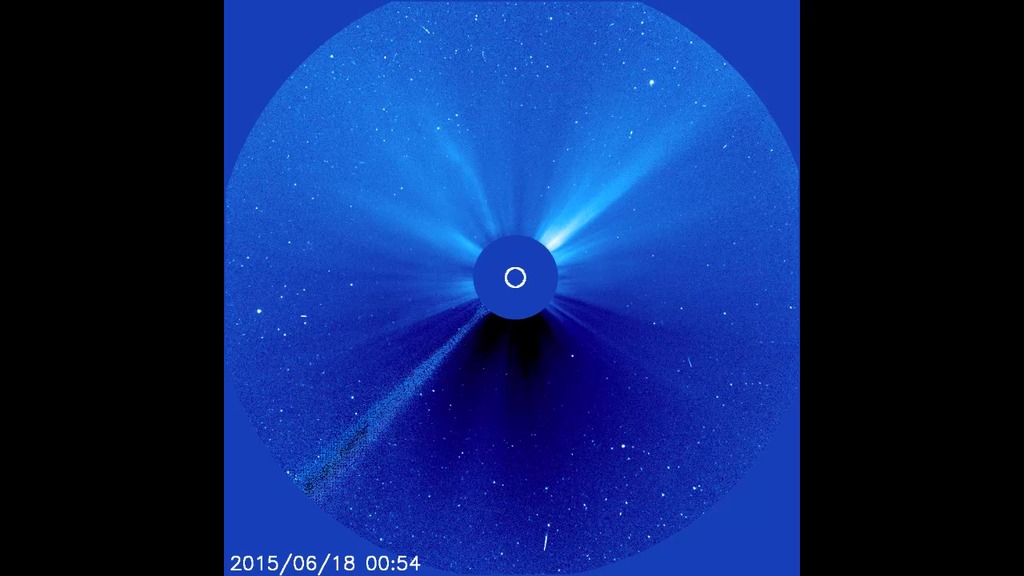
A view of multiple CMEs which erupted from the Sun in the latter half of June 2015. Their trajectories, and potential impacts on Earth and space assets, are propagated with the Enlil model.
The set of CMEs launched from the Sun in latter half of June, 2015 was modelled at the Community-Coordinated Modeling Center (CCMC) at NASA's Goddard Space Flight Center. These model runs are used for testing various space weather models and for protecting NASA assets (spacecraft AND astronauts) throughout the Solar System.
Different colors of a red, green, blue color palette are used to designate different physical variables from the simulation. When the three colors combine, they create a dramatic example of how the coronal mass ejection (CME) is different from the solar wind.
This particular model run was generated by one of the CCMC's summer interns from UMBC.

This color table represents how displaying each of the three variables as separate red, green, and blue color ramps combine to identify characteristics in the solar wind and CME.
The mass density in atomic mass units (AMUs) per cubic centimeter. 1 AMU/cc corresponds to 1 hydrogen ion or atom per cc.
Plasma temperture scale, in Kelvin.
Credits
Please give credit for this item to:
NASA's Goddard Space Flight Center Scientific Visualization Studio, the Space Weather Research Center (SWRC) and the Community-Coordinated Modeling Center (CCMC), Enlil and Dusan Odstrcil (GMU). The model run was generated by CCMC intern, Mary Aronne (UMBC).
-
Animator
- Tom Bridgman (Global Science and Technology, Inc.)
-
Producer
- Genna Duberstein (USRA)
Release date
This page was originally published on Wednesday, June 24, 2015.
This page was last updated on Wednesday, May 3, 2023 at 1:49 PM EDT.
Datasets used in this visualization
-
Enlil Heliospheric Model (Enlil Heliospheric Model)
ID: 685MHD solar wind simulation
See all pages that use this dataset -
DE421 (JPL DE421)
ID: 752Planetary ephemerides
This dataset can be found at: http://ssd.jpl.nasa.gov/?ephemerides#planets
See all pages that use this dataset -
SPICE Ephemerides (SPICE Ephemerides)
ID: 755Satellite and planetary ephemerides
See all pages that use this dataset
Note: While we identify the data sets used in these visualizations, we do not store any further details, nor the data sets themselves on our site.
Related
- ID: 11905
 Produced Video