A newer version of this visualization is available.
Maximum Antarctic Sea Ice 2014
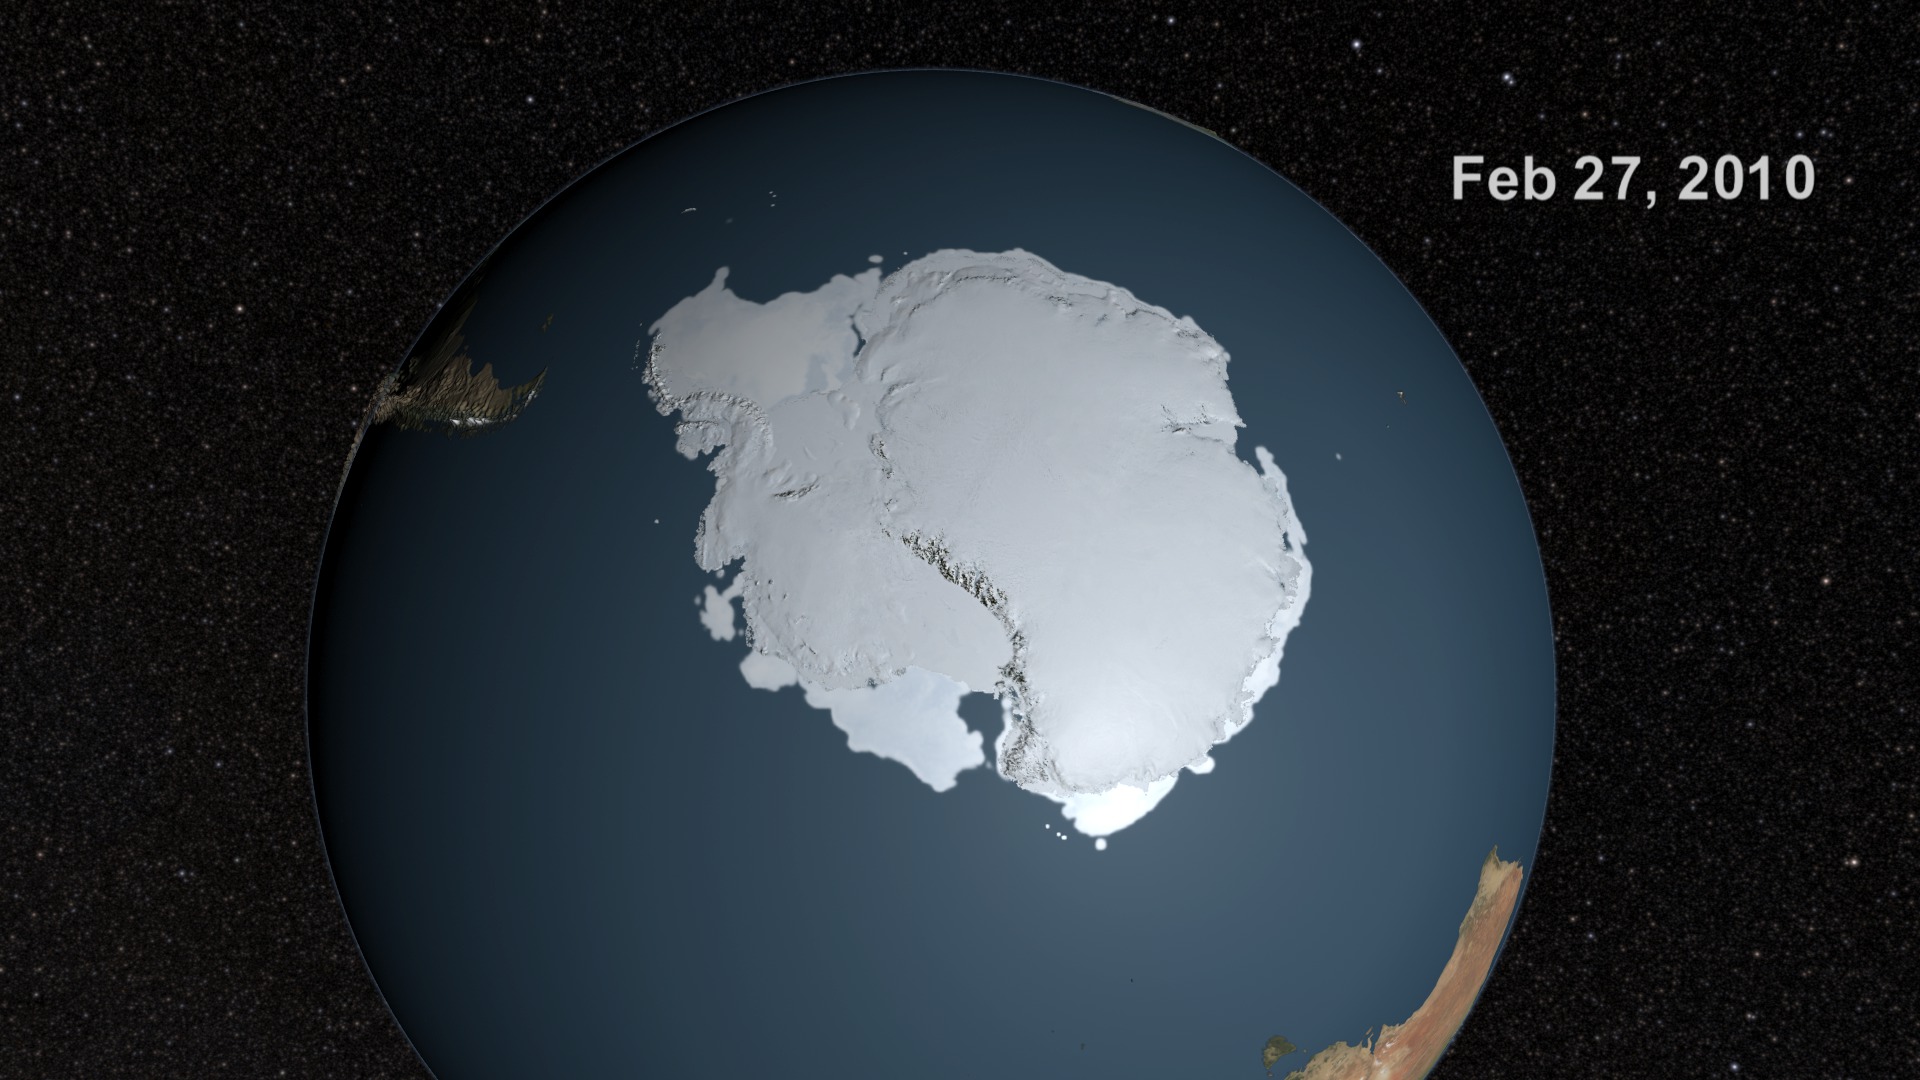
In this animation we see the Antarctic sea ice expansion from March, 21, 2014 through September 19, 2014, the date on which the sea ice reached its maximum annual extent. Over the water, the opacity of the sea ice is determined by a running 3-day maximum of the AMSR2 sea ice concentration. The blueish white color of the sea ice is a false color derived from a 3-day running minimum of the AMSR2 89 GHz brightness temperature. Over the Antarctic continent, the LIMA data shown here uses the pan-chromatic band and has a resolution of 240 meters per pixel.
An animation of the Antarctic sea ice between March 21 and September 19, 2014 when the sea ice reached its maximum extent. The red extent line shows the average of the annual maximum extents from 1979 through 2014. This animation displays the daily dates.
An animation of the Antarctic sea ice between March 21 and September 19, 2014 when the sea ice reached its maximum extent. The red extent line shows the average of the annual maximum extents from 1979 through 2014. No dates are displayed on this version.

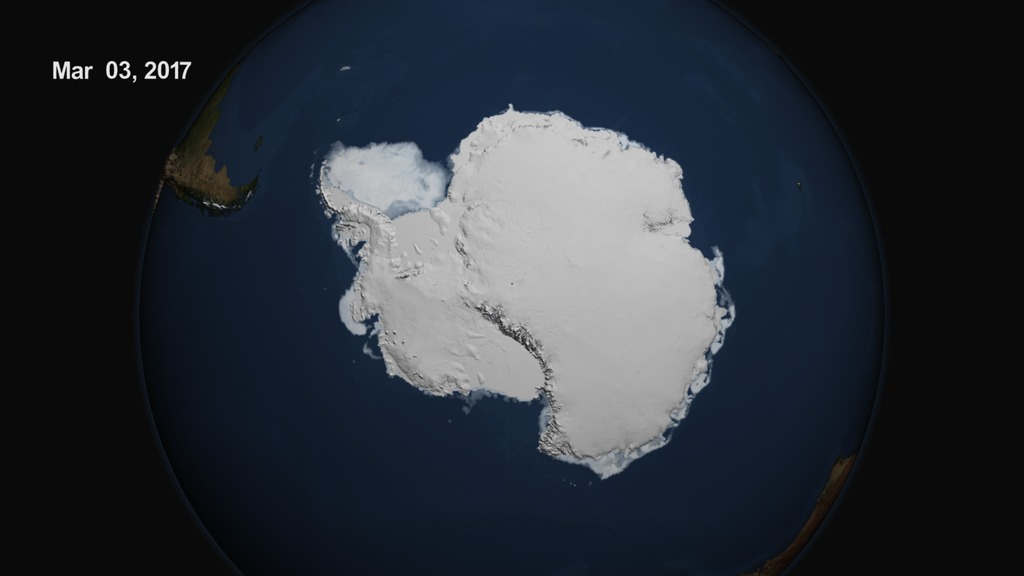
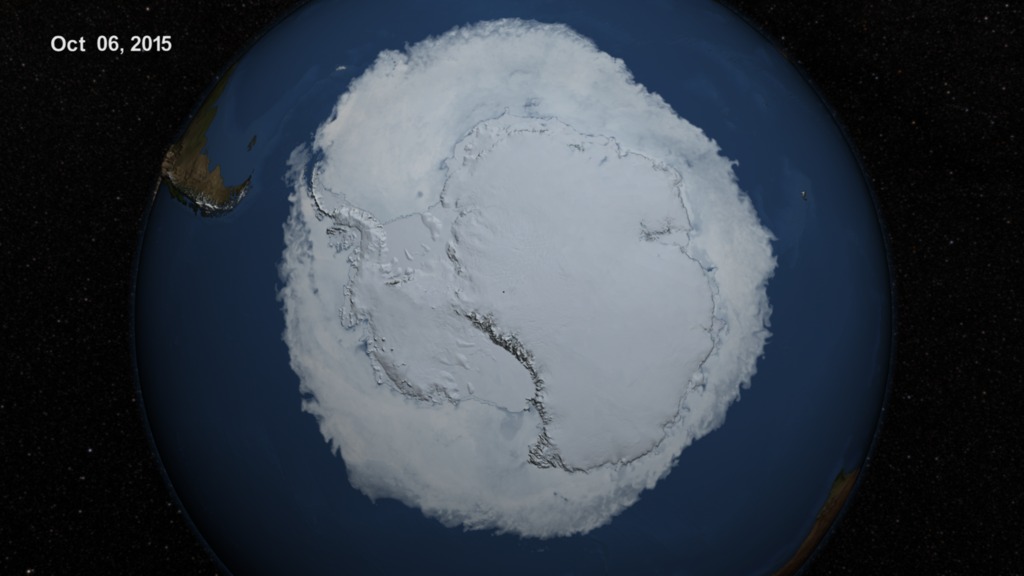
A print resolution image of the Antarctic sea ice on Setptember 19, 2014, the date on which the sea ice reached its maximum extent. The red line indicates the average of the annual maximum extents from 1979 through 2014.
A print resolution image of the Antarctic sea ice on Setptember 19, 2014, the date on which the sea ice reached its maximum extent.
A print resolution image with transparency showing the line denoting the average of the maximum sea ice extents from 1979 through 2014.
Credits
Please give credit for this item to:
NASA's Scientific Visualization Studio
-
Visualizer
- Cindy Starr (Global Science and Technology, Inc.)
-
Producer
- Joy Ng (USRA)
-
Scientists
- Josefino Comiso (NASA/GSFC)
- Robert Gersten (Wyle Information Systems)
-
Project support
- Laurence Schuler (ADNET Systems, Inc.)
- Ian Jones (ADNET Systems, Inc.)
Release date
This page was originally published on Tuesday, October 7, 2014.
This page was last updated on Wednesday, May 3, 2023 at 1:50 PM EDT.
Missions
This visualization is related to the following missions:Datasets used in this visualization
-
BMNG (Blue Marble: Next Generation) [Terra and Aqua: MODIS]
ID: 508Credit: The Blue Marble data is courtesy of Reto Stockli (NASA/GSFC).
This dataset can be found at: http://earthobservatory.nasa.gov/Newsroom/BlueMarble/
See all pages that use this dataset -
10 km Daily Sea Ice Concentration [SHIZUKU (GCOM-W1): AMSR2]
ID: 795Credit: AMSR2 data courtesy of the Japan Aerospace Exploration Agency (JAXA).
See all pages that use this dataset -
10 km Daily 89 GHz Brightness Temperature [SHIZUKU (GCOM-W1): AMSR2]
ID: 796Credit: AMSR2 data courtesy of the Japan Aerospace Exploration Agency (JAXA).
See all pages that use this dataset
Note: While we identify the data sets used in these visualizations, we do not store any further details, nor the data sets themselves on our site.
Related
- ID: 11703
 Produced Video
 - ID: 3862
 Visualization
Newer Versions
- ID: 4562
 Visualization
 - ID: 4368
 Visualization