Comparative Magnetospheres: A Noteworthy Coronal Mass Ejection
In an effort to understand and predict the impact of space weather events on Earth, the Community-Coordinated Modeling Center (CCMC) at NASA Goddard Space Flight Center, routinely runs computer models of the many historical events. These model runs are then compared to actual data to determine ways to improve the model, and therefore forecasts of the impacts of future space weather events.
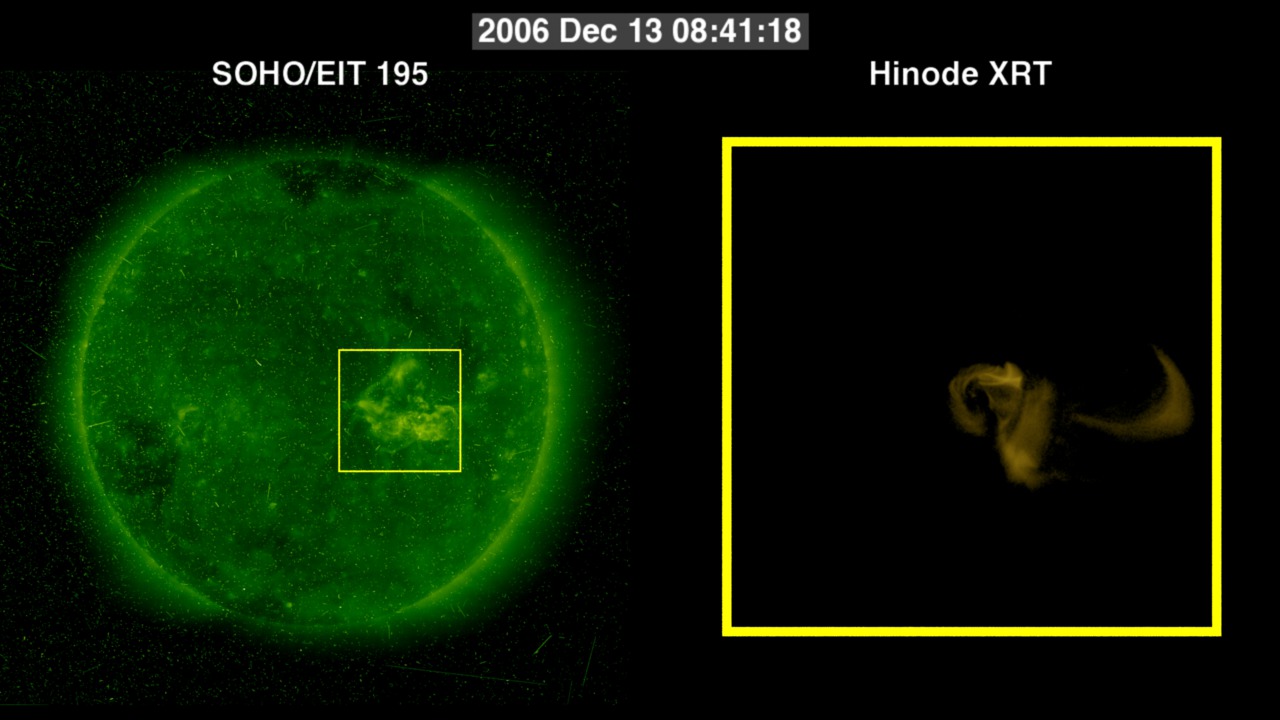
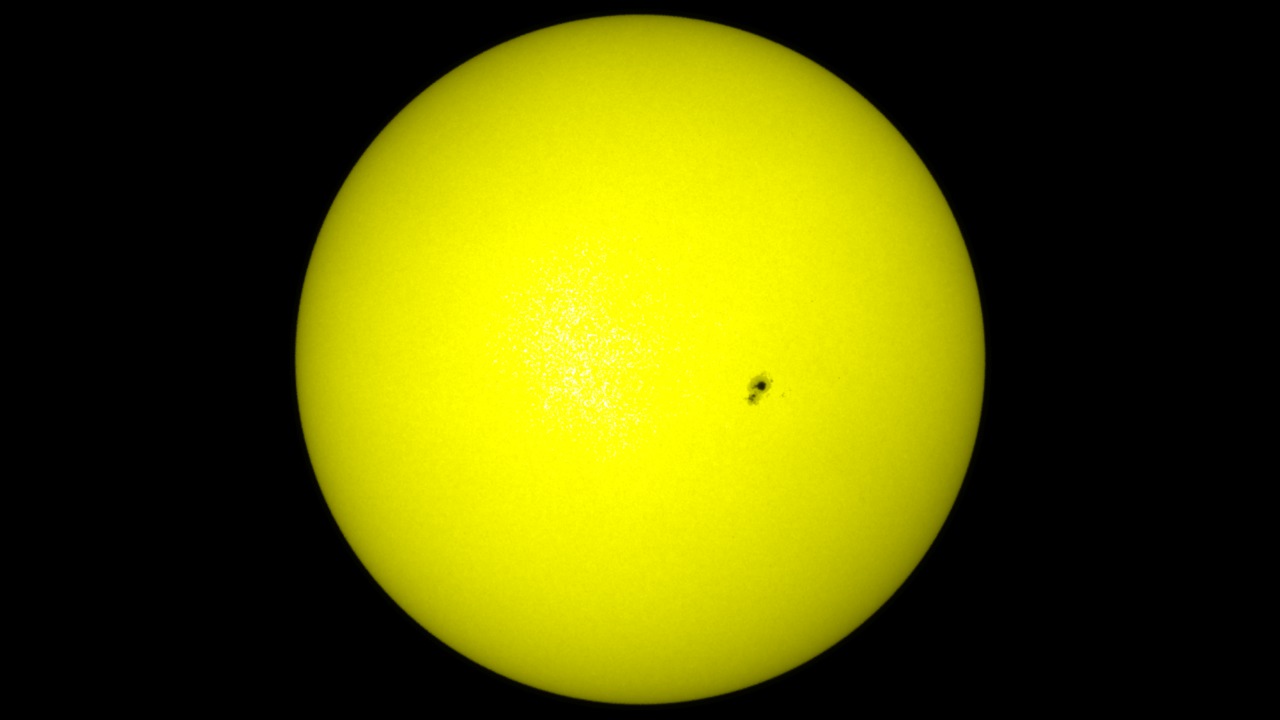
In mid-December of 2006, the Sun erupted with a bright flare and coronal mass ejection (CME) that launched particles Earthward. While not the brightest or largest event observed, its impact on Earth was substantial, requiring some effort to protect satellites (ESA: Reacting to a solar flare).
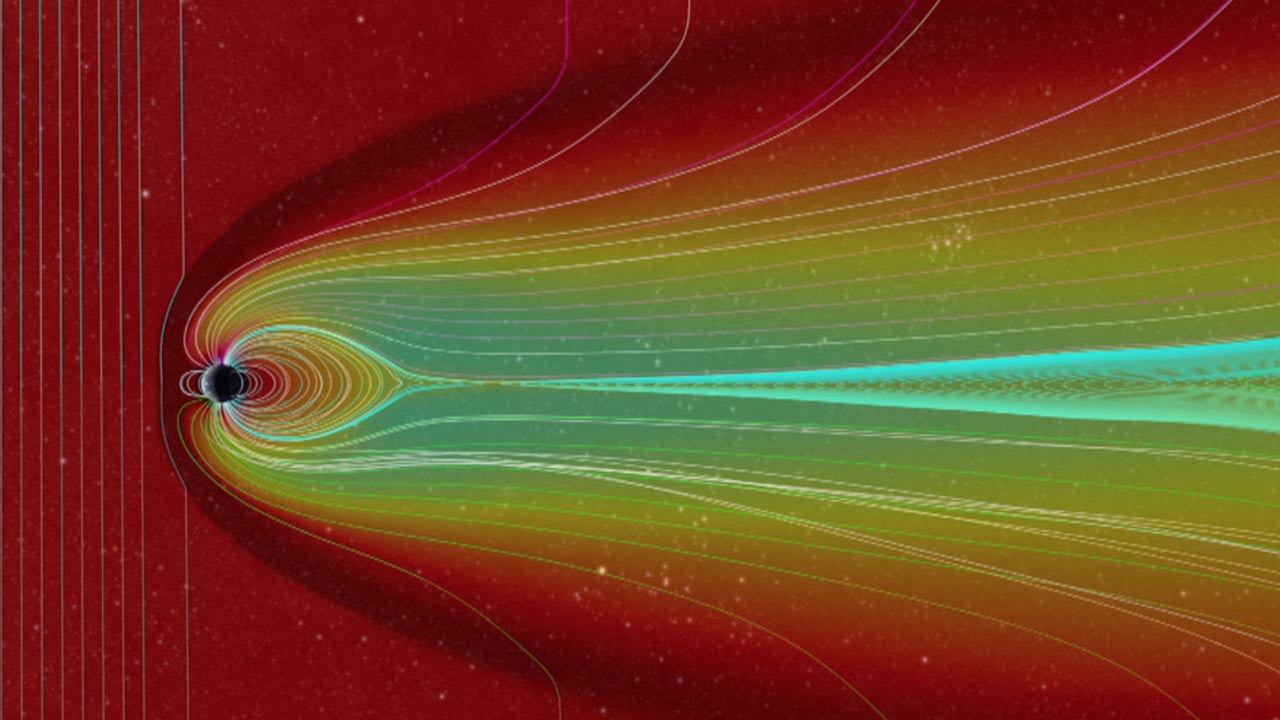
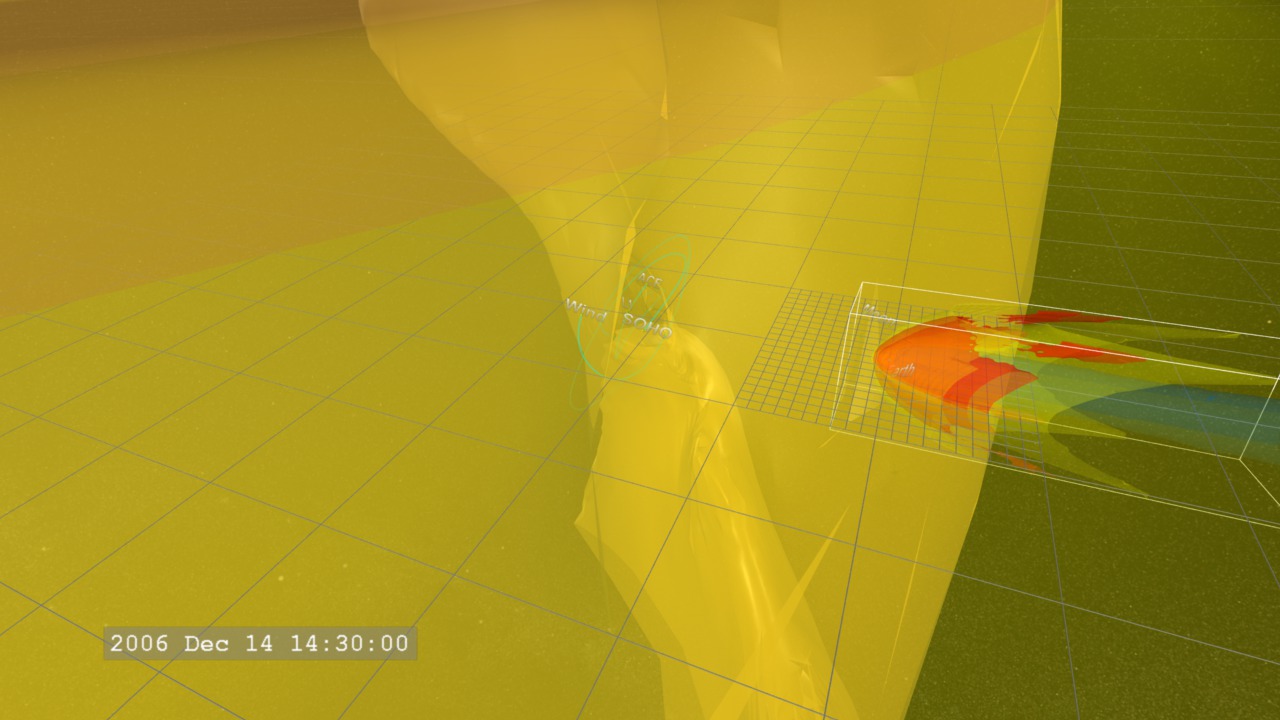
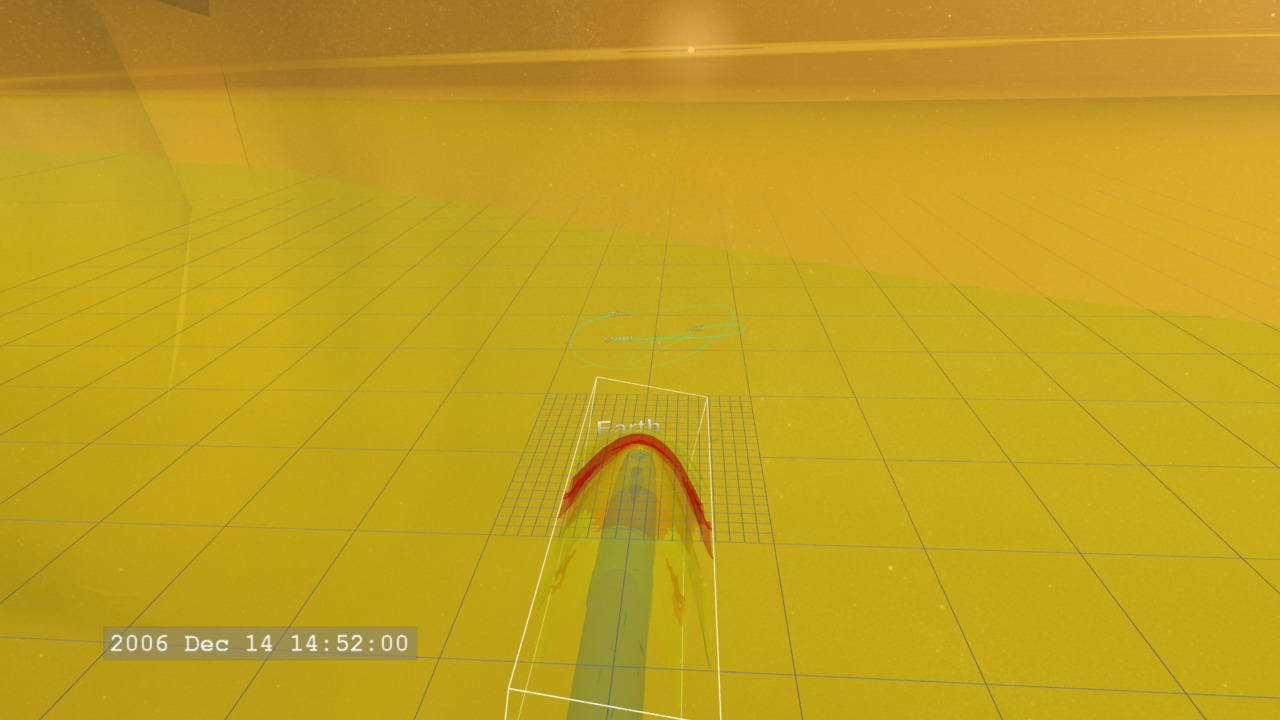
The visualization presented here is a CCMC run of a BATS-R-US model simulating the impact of this event on Earth. Here, lines are used to represent the 'flow direction' of magnetic field of the solar wind impacting Earth, as well as the effects on Earth's geomagnetic field. A 'cut-plane' through the data illustrates the changes in the particle density in the solar wind and magnetosphere. The color of the data represents a logarithmic scaling of density, with red as the highest (1000 particles per cubic centimeter) down to blue (0.01 particles per cubic centimeter). In this simulation, each frame of the movie corresponds to two minutes of real time.
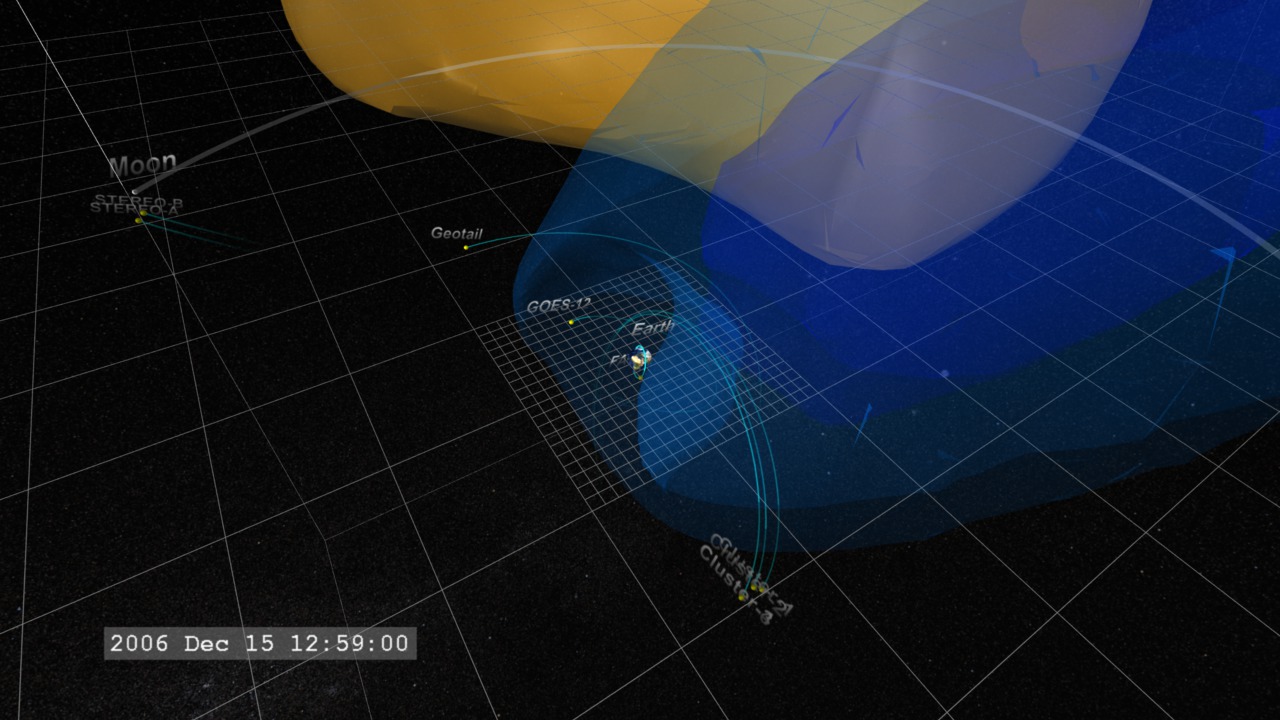
In the movie, we see vertical field lines of magnetic field carried by the solar wind, coming in from the left. As this field, and the plasma carrying it, strike Earth's magnetic field, they bend and reconnect, around the Earth. Some field lines actually reconnect to the polar regions of the Earth, providing a ready flow-path for particles to reach the ionosphere and generate aurora. This interaction between the solar wind and the plasma trapped in Earth's magnetosphere also creates a density enhancement between Earth and the solar wind helping to shield Earth from some of the effects. A lower density wake forms behind Earth (the blue region). There is a circular 'hole' around the Earth which is a gap in the model.
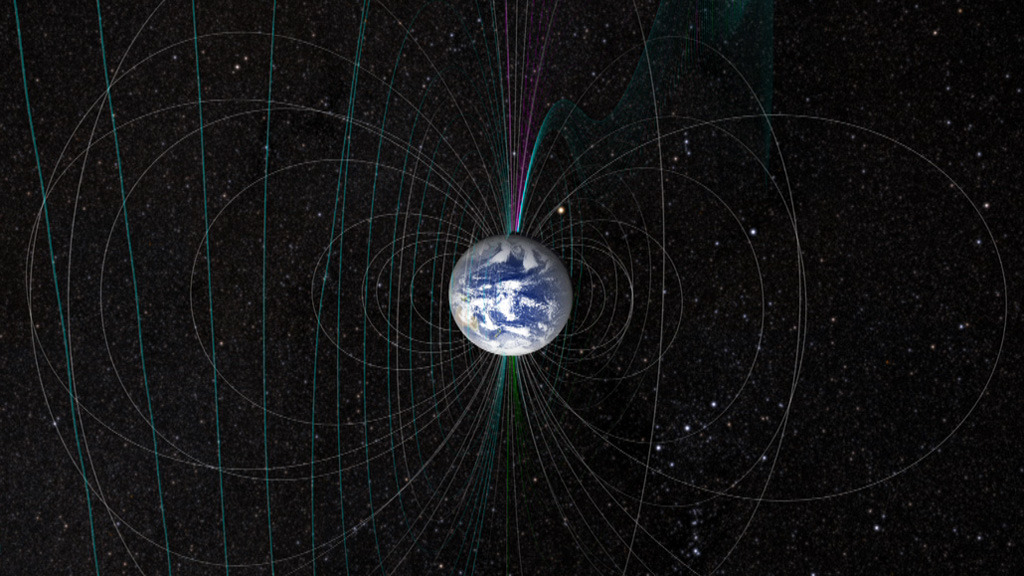
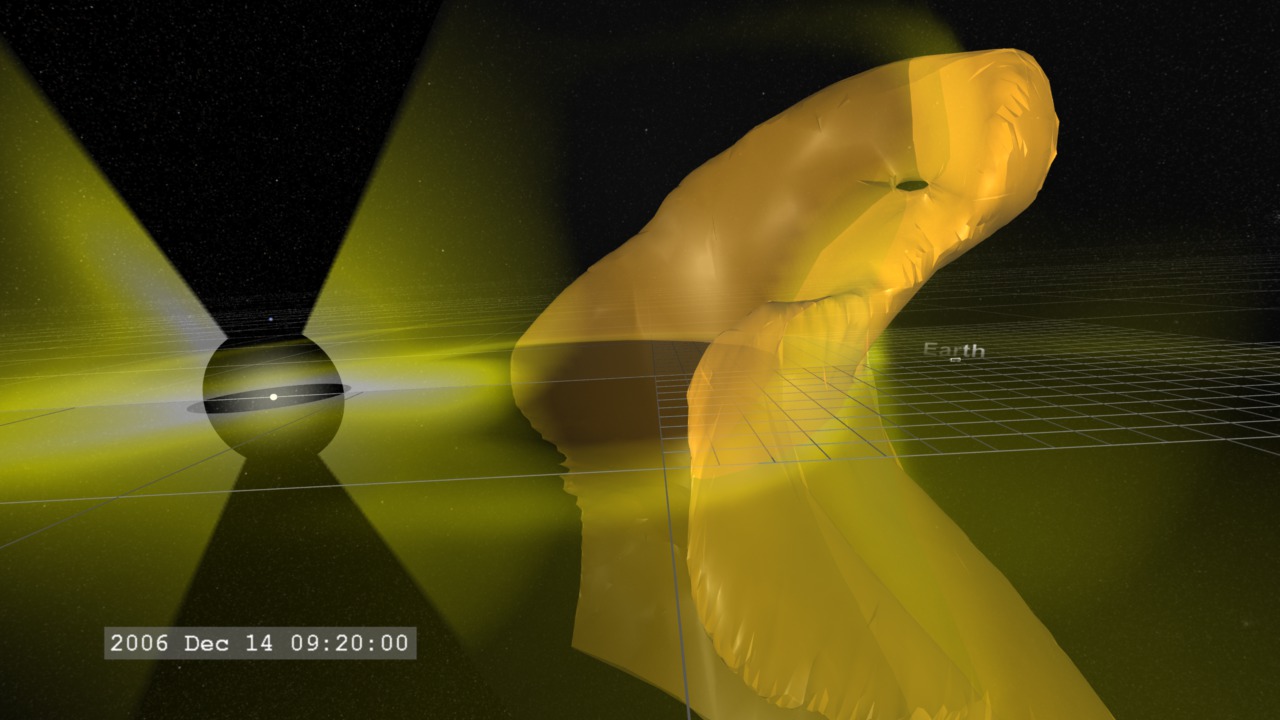
This movie opens with a close-up view of Earth with geo-magnetic field lines. The camera pulls out and fades in a profile slice of the plasma density data.
This video is also available on our YouTube channel.
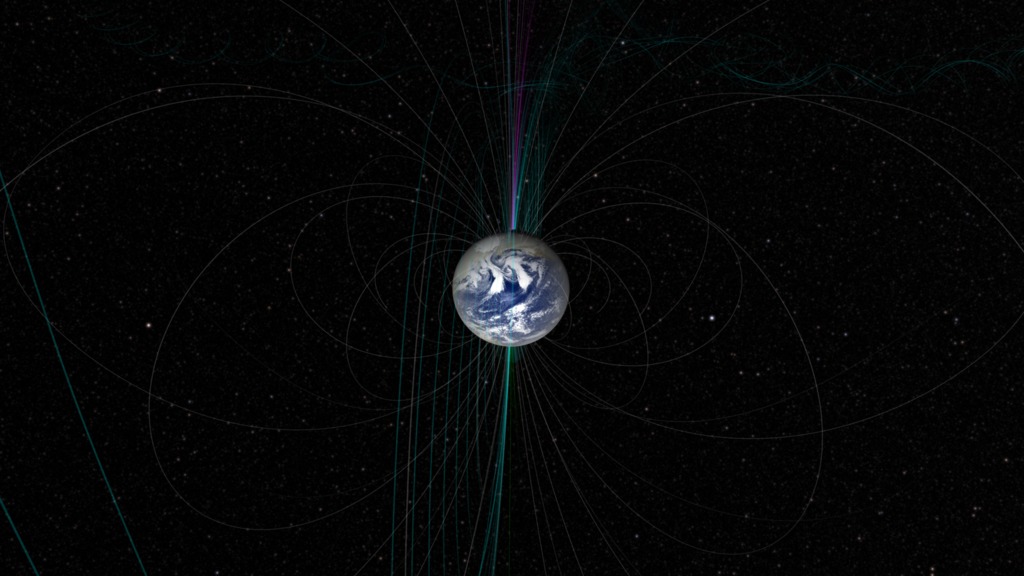
Same movie as above, but a cyan arrow marks the direction of Earth's magnetic pole.
A profile view of the magnetic field and density data. No pullout from Earth.
This movie presents an oblique view of the geo-magnetic field and a vertical slice of density data. This view provides a better look of the three-dimensional structure of the magnetic field lines as the magnetosphere evolves.
Same movie as above, but a cyan arrow marks the direction of Earth's magnetic pole.

Color bar for density data. This colorbar uses the same scale as "Comparative Magnetospheres: A Carrington-Class CME" to facilitate comparison.
Credits
Please give credit for this item to:
NASA's Scientific Visualization Studio, the Space Weather Research Center (SWRC), the Community-Coordinated Modeling Center (CCMC) and the Space Weather Modeling Framework (SWMF).
-
Animator
- Tom Bridgman (Global Science and Technology, Inc.)
-
Producer
- Genna Duberstein (USRA)
-
Scientist
- Michael Hesse (NASA/GSFC)
-
Project support
- Laurence Schuler (ADNET Systems, Inc.)
- Ian Jones (ADNET Systems, Inc.)
Release date
This page was originally published on Thursday, September 25, 2014.
This page was last updated on Tuesday, November 14, 2023 at 12:05 AM EST.
Series
This visualization can be found in the following series:Datasets used in this visualization
-
BATS-R-US Magnetosphere Model
ID: 686MHD Magnetospheric simulation
See all pages that use this dataset
Note: While we identify the data sets used in these visualizations, we do not store any further details, nor the data sets themselves on our site.
Related
- ID: 11689
 Produced Video
 - ID: 4189
 Visualization
 - ID: 11660
 Produced Video
 - ID: 3902
 Visualization
 - ID: 3755
 Visualization
 - ID: 3740
 Visualization
 - ID: 3742
 Visualization
 - ID: 3743
 Visualization
 - ID: 3739
 Visualization
 - ID: 3411
 Visualization