The Sun's Magnetic Field
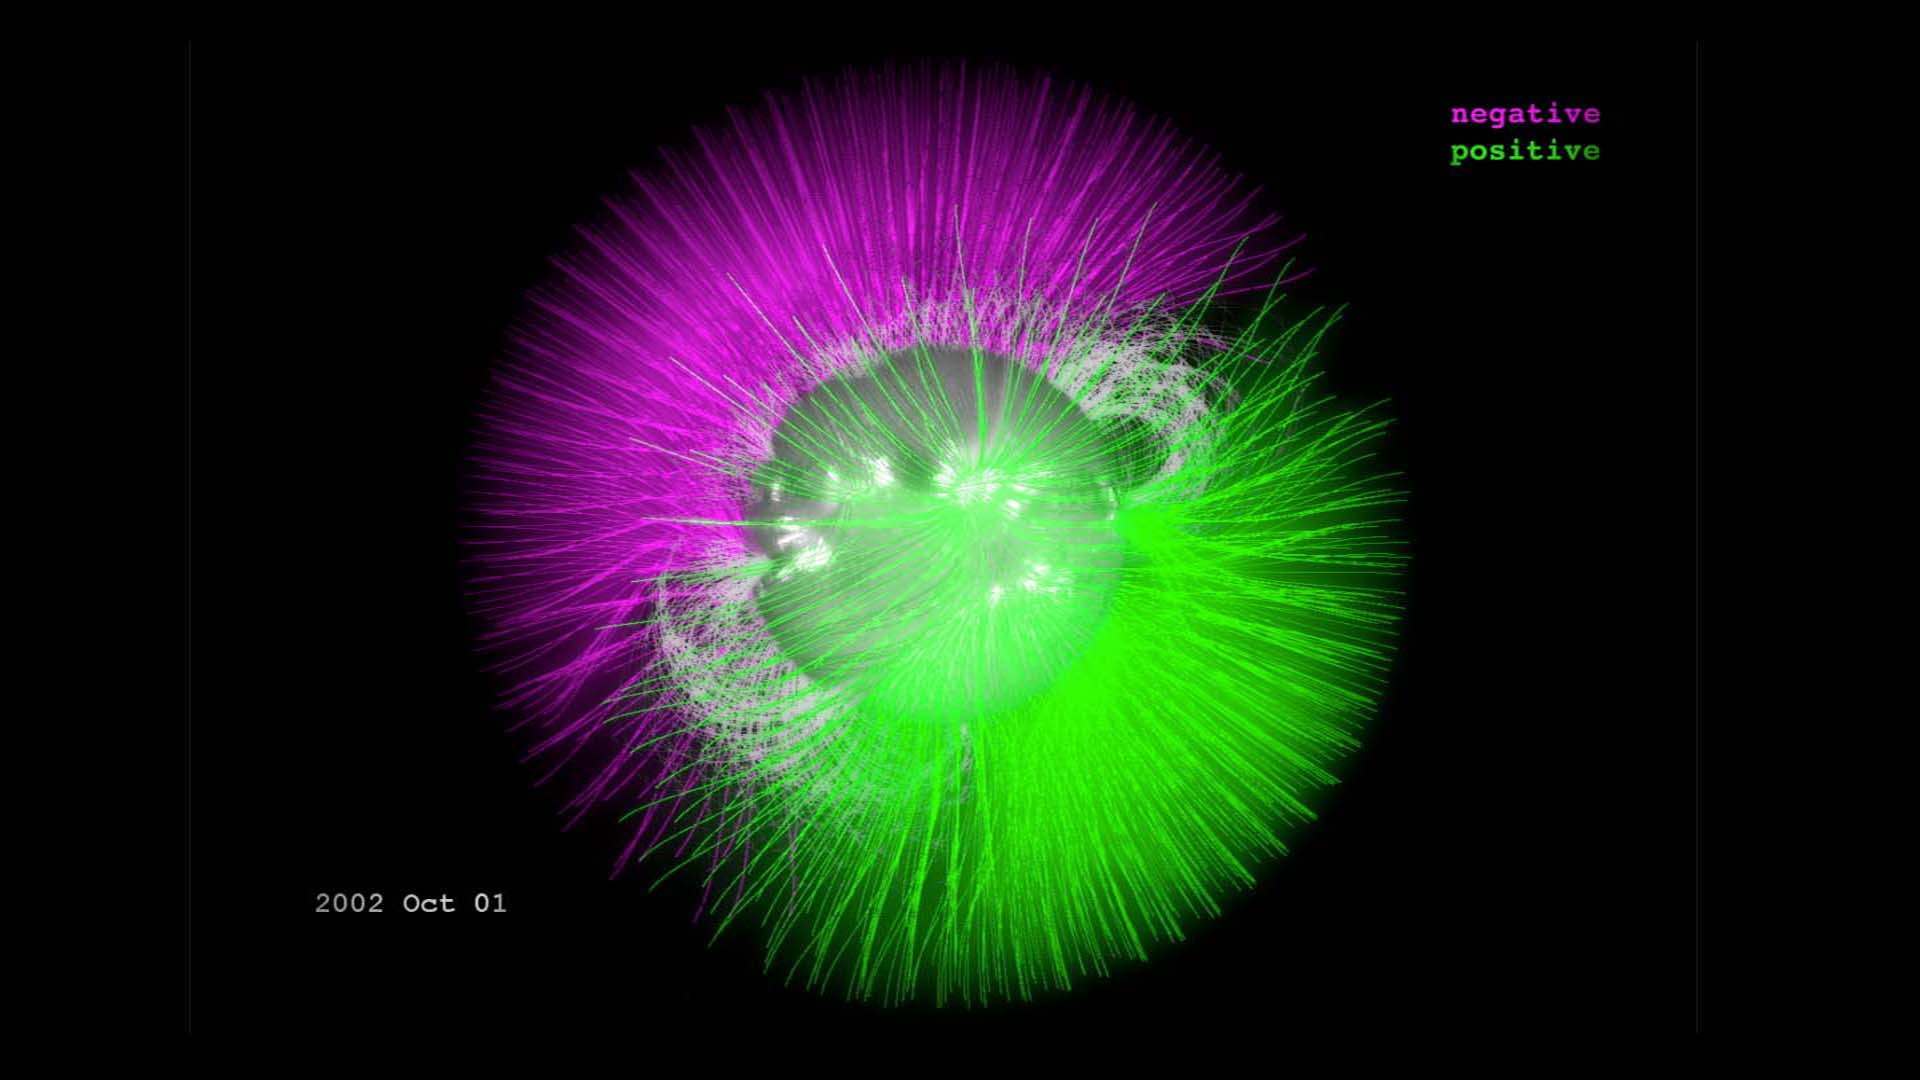
During the course of the approximately 11 year sunspot cycle, the magnetic field of the Sun reverses. The last time this happened was around the year 2000.
Using magnetograms from the SOHO/MDI and SDO/HMI instruments, it is possible to examine possible configurations of the magnetic field above the photosphere. These magnetic configurations are important in understanding potential conditions of severe space weather.
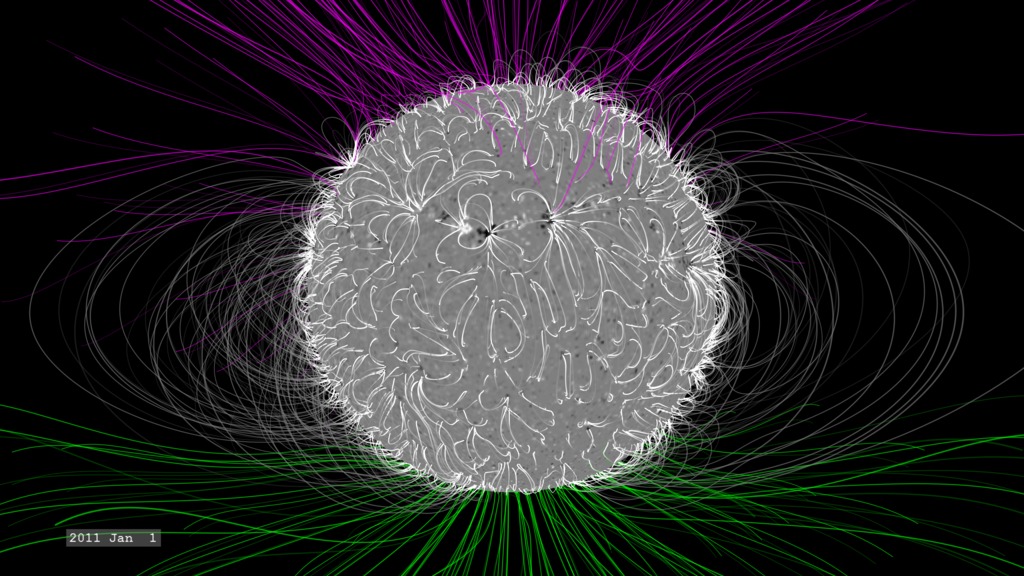
The magnetic field in this animation is constructed using the Potential Field Source Surface (PFSS) model. The PFSS model is one of the simplest yet realistic models we can explore. Using the solar magnetograms as the 'source surface' of the field, it builds the field structure from the photosphere out to about two solar radii (an altitude of 1 solar radius). These visuals were generated using the SolarSoft package.
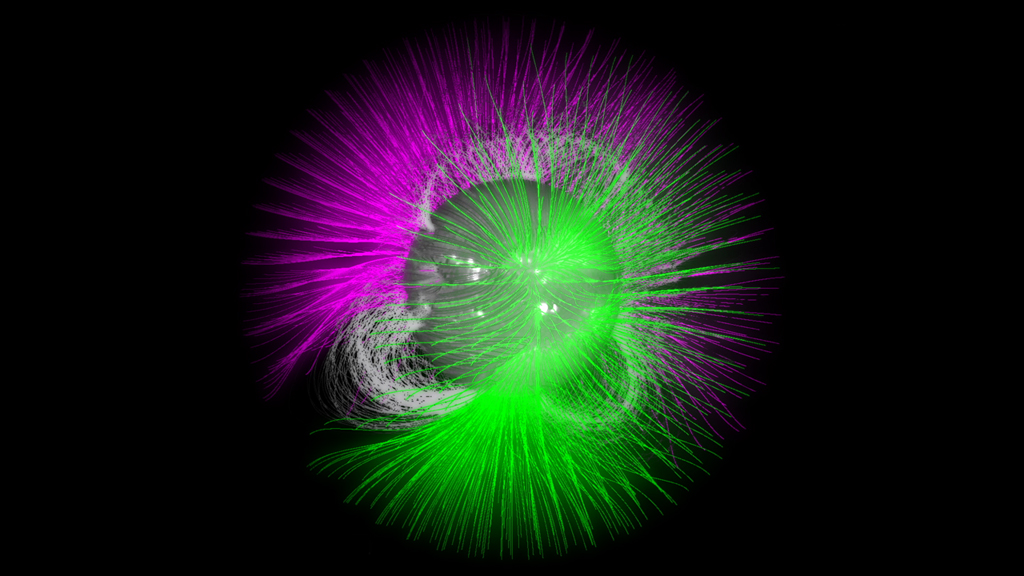
In this visualization, the white magnetic field lines are considered 'closed'. The move up, and then return to the solar surface. The green and violet lines represenent field lines that are considered 'open'. Green represents positive magnetic polarity, and violet represents negative polarity. These field lines do not connect back to the Sun but with more distant magnetic fields in space. These field lines act as easy 'roads' for the high-speed solar wind.
Evolution of the solar magnetic field from 1997 to 2013. Version with time-stamp written in the image file.
Frames of the magnetic field movie. Instead of sequential frame numbers, the file name is tagged by year, month, and day: YYYYMMDD.
Credits
Please give credit for this item to:
NASA's Goddard Space Flight Center Scientific Visualization Studio
-
Animator
- Tom Bridgman (Global Science and Technology, Inc.)
-
Producer
- Genna Duberstein (USRA)
-
Writer
- Karen Fox (ADNET Systems, Inc.)
Release date
This page was originally published on Thursday, December 5, 2013.
This page was last updated on Wednesday, May 3, 2023 at 1:51 PM EDT.
Datasets used in this visualization
-
PFSS (Magnetic Field Lines) [PFSS]
ID: 409This model generated from SOHO/MDI magnetograms through the SolarSoft package.
This dataset can be found at: http://sohowww.nascom.nasa.gov/solarsoft/
See all pages that use this dataset -
Magnetogram [SOHO: Michelson Doppler Interferometer (MDI)]
ID: 618This dataset can be found at: http://sohowww.nascom.nasa.gov
See all pages that use this dataset -
SDO Magnetogram (Magnetogram) [SDO: HMI]
ID: 675
Note: While we identify the data sets used in these visualizations, we do not store any further details, nor the data sets themselves on our site.
Related
- ID: 4623
 Visualization
 - ID: 4391
 Visualization
 - ID: 11419
 Produced Video
 - ID: 11429
 Produced Video
Used as a Source In
- ID: 13527
![VideoWatch this video on the NASA Goddard YouTube channel.Music credits: “Oxide” and “Virtual Tidings” by Andrew Michael Britton [PRS], David Stephen Goldsmith [PRS]; “Progressive Practice” by Emmanuel David Lipszc [SACEM], Franck Lascombes [SACEM], Sebastien Lipszyc [SACEM]; “Political Spectrum” by Laurent Dury [SACEM} from Universal Production MusicComplete transcript available.](/vis/a010000/a013500/a013527/13537_SolarOrbiterOverview_YouTube.00725_print.jpg) Produced Video
Produced Video