Greenland's Mega-Canyon beneath the Ice Sheet
Subglacial topography plays an important role in modulating the distribution and flow of meltwater beneath the ice known as basal water flow. This animation portrays topographic data of the bedrock under the Greenland ice sheet derived from ice-penetrating radar data. Clearly evident in the topography is a 750-km-long subglacial canyon in northern Greenland that is likely to have influenced basal water flow from the ice sheet interior to the margin. The authors suggest that the mega-canyon predates ice sheet inception and has influenced basal hydrology in Greenland over past glacial cycles. (See reference under "Science Paper" below)
Starting with a view of the surface of Greenland, the animation zooms closer to the surface as the ice sheet is stripped away to reveal the false-color topography of the bedrock that lies beneath. Regions above sea level are shown in shades of green while areas below zero are colored by shades of brown. Yellow indicates the area near sea level. The topography is exaggerated from 12 to 40 times in order to accentuate the topographic relief. Visible in the topography from about the midpoint of Greenland to its Northwest coast is the 750-km-long subglacial canyon described by the authors.
Animation of Greenland's mega-canyon.
This video is also available on our YouTube channel.
The above visualization with the color scale shown in the upper right corner.

The color scale applied to the topography.

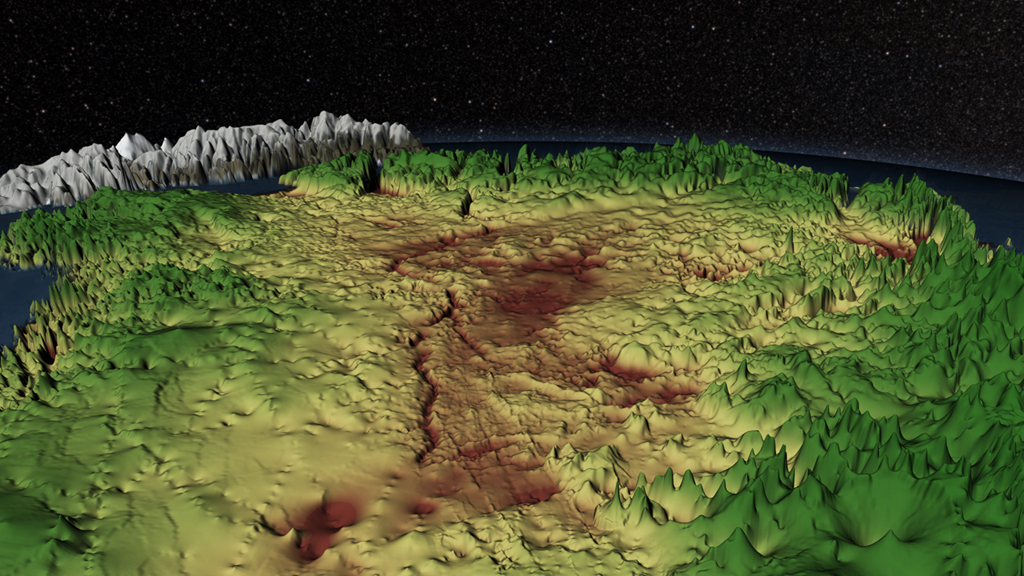
A print resolution still image Greenland's topography displayed in false-color based on the elevation with the Greenland Ice Sheet shown partially removed. Regions of the topography above sea level are shown in shades of green while areas below zero are coloured by shades of brown. Yellow indicates the area near sea level. The topography is exaggerated by 19.5 times.
A print resolution still image Greenland's topography displayed in false-color based on the elevation. Regions of the topography above sea level are shown in shades of green while areas below zero are coloured by shades of brown. The canyon is evident meandering down the middle of Greenland colored in deep brown. Yellow indicates the area near sea level. The topography is exaggerated by 40 times.
A print resolution still image Greenland's topography displayed in false-color based on the elevation. Regions of the topography above sea level are shown in shades of green while areas below zero are coloured by shades of brown. The canyon is evident meandering down the middle of Greenland colored in deep brown. Yellow indicates the area near sea level. The topography is exaggerated by 40 times.
A print resolution still image showing the location of the canyon in blue on the surface of the ice sheet. The topography is exaggerated by 15 times.
The Earth layer alone with transparency at gamma 1.0.
The atmosphere layer alone with transparency at gamma 1.0.
The star layer alone at gamma 1.0.
Credits
Please give credit for this item to:
NASA's Goddard Space Flight Center Scientific Visualization Studio
The Blue Marble Next Generation data is courtesy of Reto Stockli (NASA/GSFC).
-
Visualizer
- Cindy Starr (Global Science and Technology, Inc.)
-
Animator
- Greg Shirah (NASA/GSFC)
-
Producer
- Jefferson Beck (USRA)
-
Scientists
- J. L. Bamber (School of Geographical Sciences, University of Bristol, UK)
- Michael Studinger (NASA/GSFC)
-
Project support
- Laurence Schuler (ADNET Systems, Inc.)
- Ian Jones (ADNET Systems, Inc.)
Release date
This page was originally published on Thursday, August 29, 2013.
This page was last updated on Wednesday, May 3, 2023 at 1:51 PM EDT.
Missions
This visualization is related to the following missions:Papers used in this visualization
Bamber, J.L., Siegert, M.J., Griggs, J.A., Marshall, S., Spada, G. Paleofluvial canyon drains subglacial water from northern Greenland, Science, 2013.Bamber, J. L., Griggs, J. A., Hurkmans, R. T. W. L., Dowdeswell, J. A., Gogineni, S. P., Howat, I., Mouginot, J., Paden, J., Palmer, S., Rignot, E., and Steinhage, D.: A new bed elevation dataset for Greenland, The Cryosphere, 7, 499-510, 10.5194/tc-7-499-2013, 2013. (Available here.)
Datasets used in this visualization
-
BMNG (Blue Marble: Next Generation) [Terra and Aqua: MODIS]
ID: 508Credit: The Blue Marble data is courtesy of Reto Stockli (NASA/GSFC).
This dataset can be found at: http://earthobservatory.nasa.gov/Newsroom/BlueMarble/
See all pages that use this dataset -
GIMP Greenland DEM (Greenland Mapping Project (GIMP) Digital Elevation Model)
ID: 746 -
Greenland bed elevation dataset by Bamber, et al., 2013
ID: 798
Note: While we identify the data sets used in these visualizations, we do not store any further details, nor the data sets themselves on our site.
Related
- ID: 11350
 Produced Video