Landsat-8 Long Swath
Landsat-8 launched February 11th, 2013. This visualization shows one of the first full swaths of data taken on April 19th, 2013, only one week after Landsat-8 ascended to its final altitude of 438 miles (705 km).
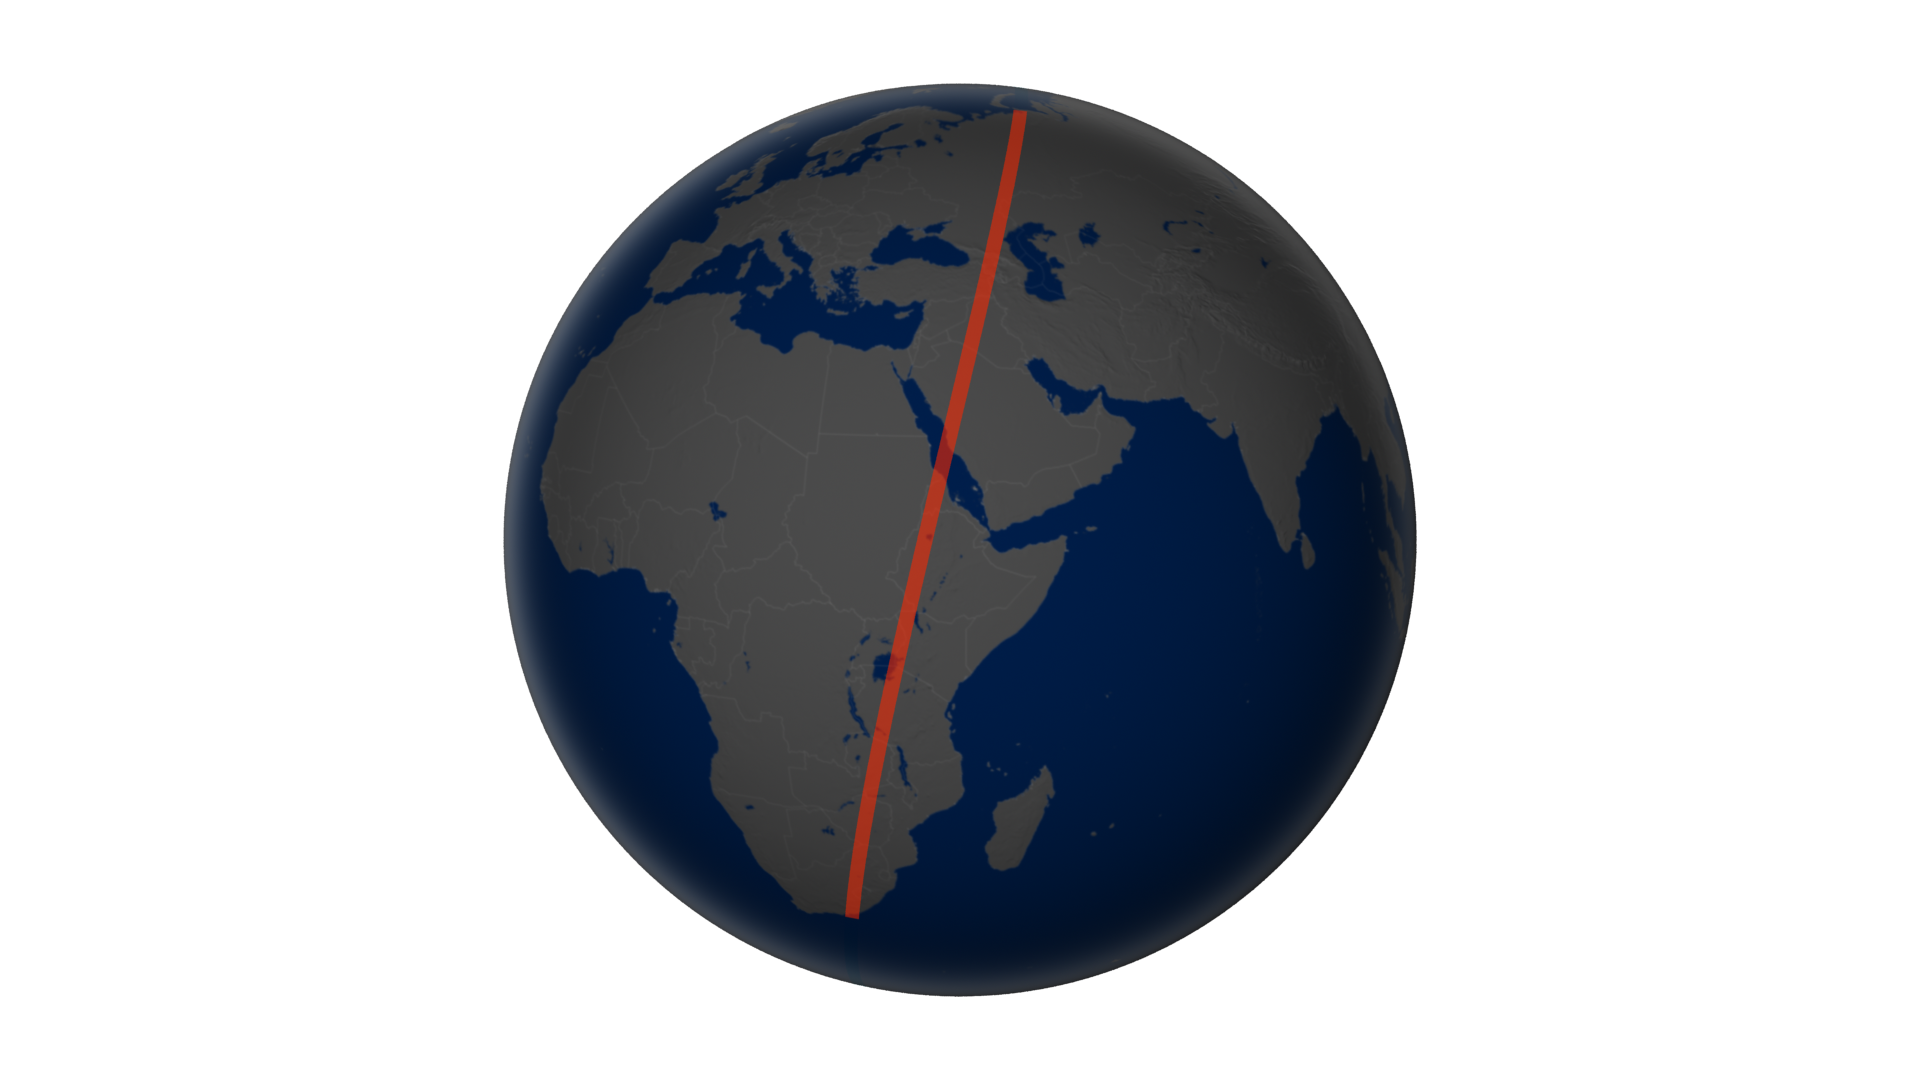
Example animation compositing the Landsat swath traverse with window tracker. The window tracker highlights where we are on the swath.
Animation of the window tracker icon layer. This layer is synchronized with the swath traverse layer and can be used together to identify where we along the swath traverse.
Animation of the swath traverse. This layer is synchronized with the window tracker. (Layer generated by Matthew R. Radcliff.)
Credits
Please give credit for this item to:
NASA's Goddard Space Flight Center Scientific Visualization Studio
-
Animator
- Alex Kekesi (Global Science and Technology, Inc.)
-
Video editor
- Matthew R. Radcliff (USRA)
-
Producer
- Matthew R. Radcliff (USRA)
-
Scientist
- James R. Irons (NASA/GSFC)
-
Project support
- Jesse Allen (Sigma Space Corporation)
- Robert Simmon (Sigma Space Corporation)
- Laurence Schuler (ADNET Systems, Inc.)
- Ian Jones (ADNET Systems, Inc.)
- Leann Johnson (Global Science and Technology, Inc.)
Release date
This page was originally published on Wednesday, May 15, 2013.
This page was last updated on Wednesday, May 3, 2023 at 1:52 PM EDT.
Missions
This visualization is related to the following missions:Datasets used in this visualization
-
True Color (Band Combination 2,3,4) [Landsat-8: OLI]
ID: 784
Note: While we identify the data sets used in these visualizations, we do not store any further details, nor the data sets themselves on our site.
Related
- ID: 11249
 Produced Video