LEND Looks for Water at the South Pole
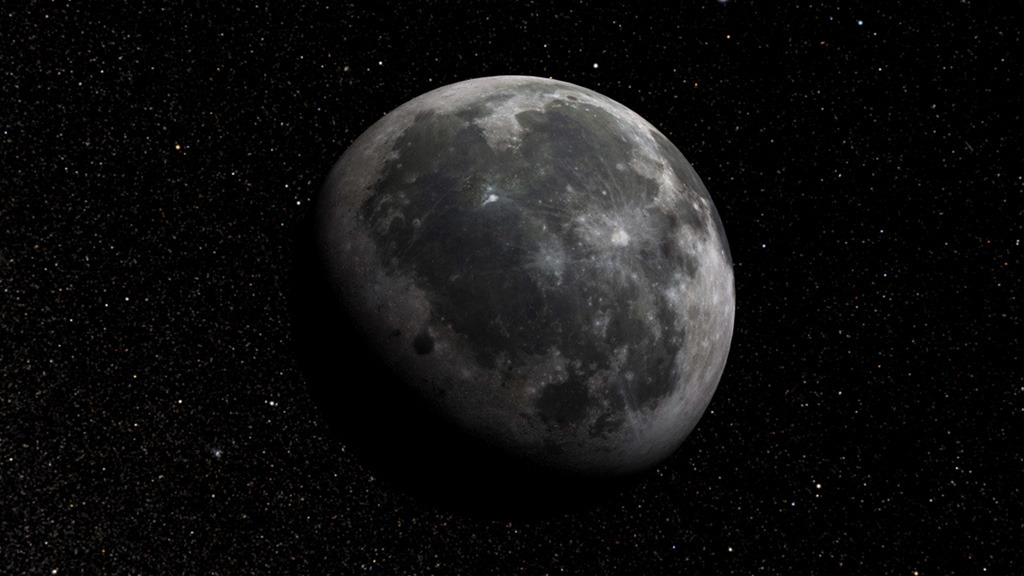
Since Lunar Reconnaissance Orbiter (LRO) entered lunar orbit in 2009, its neutron detector, LEND, has been counting the neutrons coming from the Moon's surface.
Neutrons are created when galactic cosmic rays strike atoms in the lunar regolith. These neutrons bounce from atom to atom like billiard balls, losing energy with each collision. Along the way, some of these neutrons escape into space, where LEND can detect them.
The presence of hydrogen in the lunar soil reduces the number of neutrons that escape. To map out likely deposits of water ice, LEND scientists look for this deficit of neutrons in the epithermal (medium) energy range.
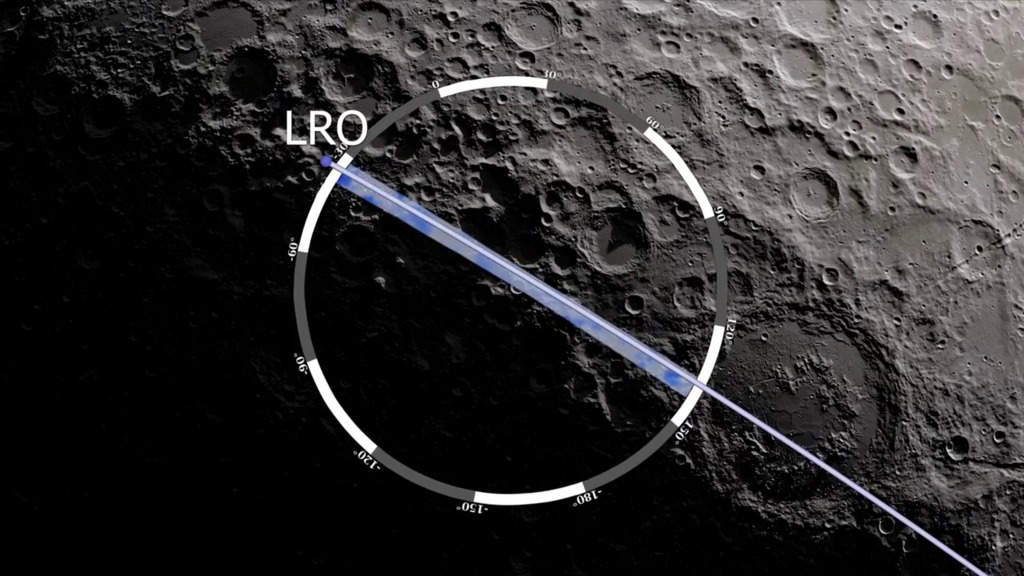
If the deficit were simply due to random fluctuations, the hydrogen map would never coalesce into a sharp image, but as this animation shows, the map of epithermal neutron deficit at the south pole of the Moon improves over time and converges on particular spots. These include especially strong signals in the permanently shadowed parts of Cabeus and Shoemaker craters, where ice would be completely shielded from the sun. But LEND and other missions have found signs of water in places that aren't permanently shadowed while apparently excluding some places that are, both of which are surprising and exciting discoveries.
We follow LRO to the south pole and watch as the LEND instrument integrates neutron counts over the three years from July 2009 to June 2012.
This video is also available on our YouTube channel.
The as-rendered frames of the first entry, without the annotations (colorbar, date, crater labels).
Similar to the first entry, but with a shorter running time. The middle and end of the animation run two to five times faster.

An animated colorbar. The maximum and minimum count rate are far apart initially, but as neutron counts are integrated over time, the bounds narrow and then settle at a stable range.
Date annotation for each frame of the first entry. Includes mission elapsed time in years.
The crater label overlay.
A high-resolution still image formatted for NASA's hyperwall.
A print resolution still image that visualizes the LEND data using a somewhat different treatment.
Credits
Please give credit for this item to:
NASA's Goddard Space Flight Center Scientific Visualization Studio
-
Animator
- Ernie Wright (USRA)
-
Producers
- Silvia Stoyanova (USRA)
- Dan Gallagher (USRA)
-
Scientists
- Tim McClanahan (NASA)
- John Keller (NASA/GSFC)
Release date
This page was originally published on Monday, March 25, 2013.
This page was last updated on Tuesday, November 14, 2023 at 12:04 AM EST.
Missions
This visualization is related to the following missions:Series
This visualization can be found in the following series:Datasets used in this visualization
-
DEM (Digital Elevation Map) [LRO: LOLA]
ID: 653 -
Neutrons [LRO: LEND]
ID: 672 -
SPICE Ephemerides (SPICE Ephemerides)
ID: 755Satellite and planetary ephemerides
See all pages that use this dataset
Note: While we identify the data sets used in these visualizations, we do not store any further details, nor the data sets themselves on our site.
Related
- ID: 11756
 Produced Video
 - ID: 11292
 Produced Video