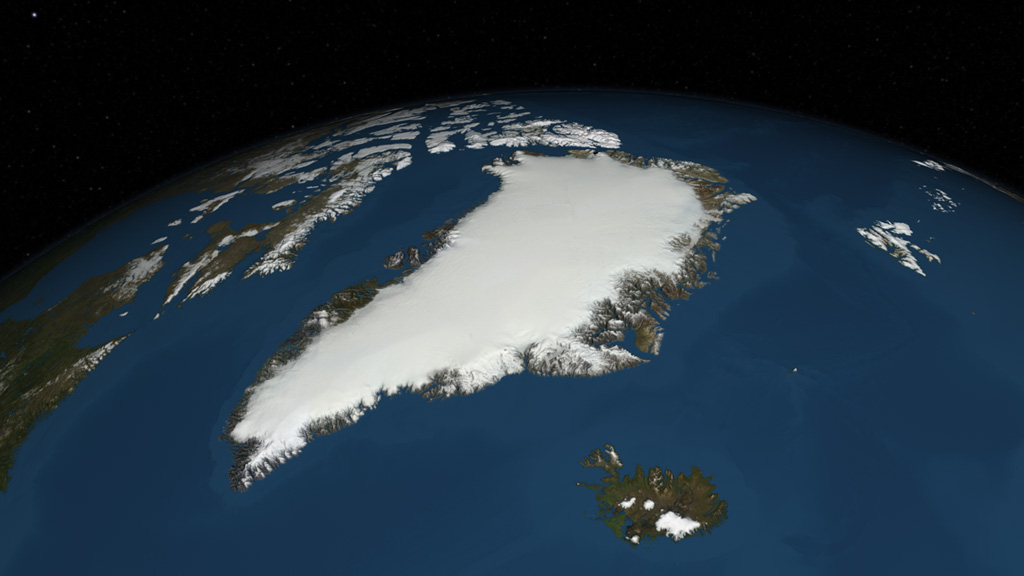
Measuring Elevation Changes on the Greenland Ice Sheet
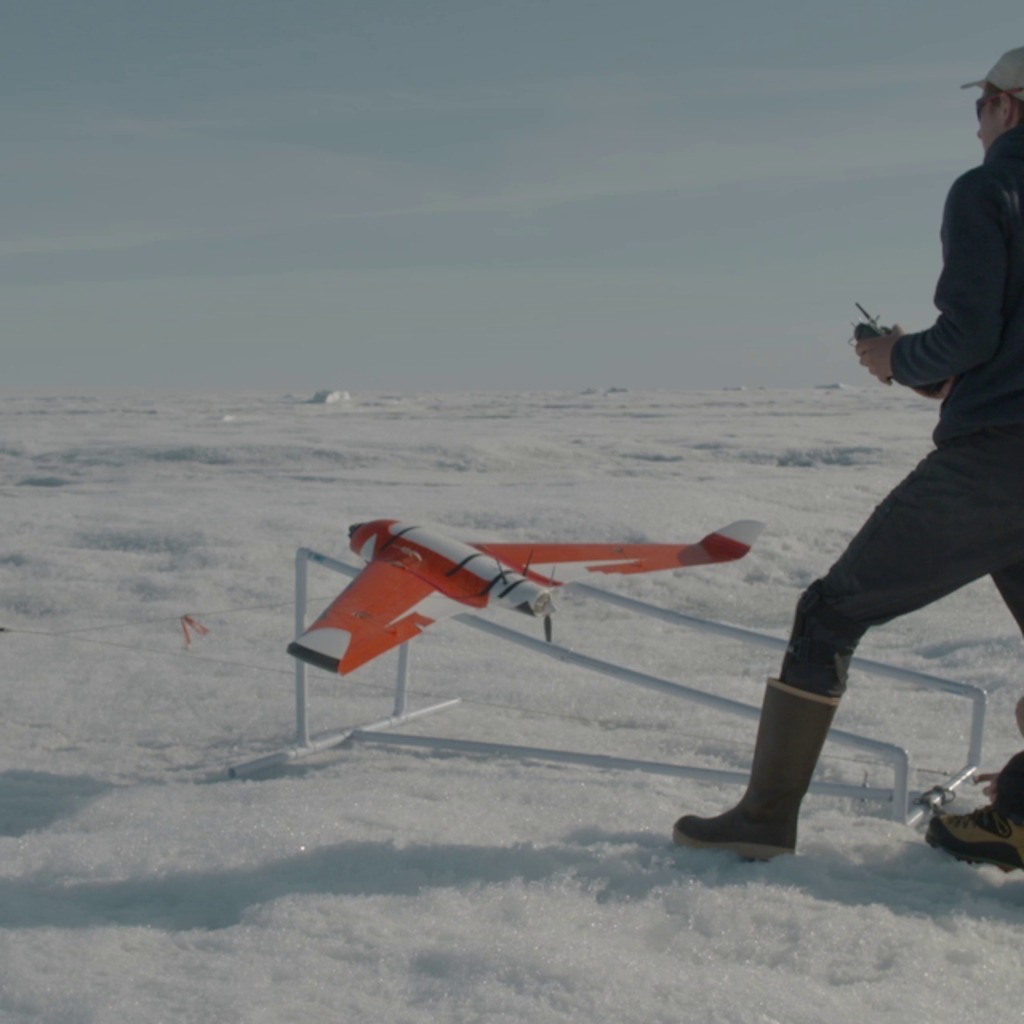
Since the late 1970's, NASA has been monitoring changes in the Greenland Ice Sheet. Recent analysis of seven years of surface elevation readings from NASA's ICESat satellite and four years of laser and and ice-penetrating radar data from NASA's airborne mission Operation IceBridge shows us how the surface elevation of the ice sheet has changed.
The colors shown on the surface of the ice sheet represent the accumulated change in elevation since 2003. The light yellow over the central region of the ice sheet indicates a slight thickening due to snow. This accumulation, along with the weight of the ice sheet, pushes ice toward the coast. Thinning near coastal regions, shown in green, blue and purple, has increased over time and now extends into the interior of the ice sheet where the bedrock topography permits. As a result, there has been an average loss of 300 cubic kilometers of ice per year between 2003 and 2012.
This animation portrays the changes occurring in the surface elevation of the ice sheet since 2003 in three drainage regions: the southeast, the northeast and the Jakobshavn regions. In each region, the time advances to show the accumulated change in elevation from 2003 through 2012.
Above: Move bar to compare the change in surface elevation (left) to the bedrock topography (right) in the northeast region. Download HTML to embed this in your web page.
The ice sheet is cut away to reveal how the bedrock topography beneath the ice sheet affects the movement of glacial ice in each region. The bedrock topography is colored by elevation with areas below sea level shown in brown and areas above sea level shown in green. Yellow indicates regions at sea level.
Above: Move bar to compare the change in the surface elevation (left) to the bedrock topography (right) in the Jakobshavn region. Download HTML to embed this in your web page.
The bedrock topography affects the movement of the ice sheet. Blue/white velocity flows indicate the direction and speed of the ice over time. Slower moving ice is shown as shorter blue flow lines while faster moving ice is shown as longer white flow lines.
This narrated animation shows the accumulated change in the elevation of the Greenland ice sheet between 2003 and 2012. This is the official release without the scrolling credits.
If needed, a complete transcript is available.
This narrated animation shows the accumulated change in the elevation of the Greenland ice sheet between 2003 and 2012. This version has the full list of scrolling credits at the end of the animation.
If needed, a complete transcript is available.

This print resolution image shows where measurements were taken on the Greenland Ice sheet. The paths of the ICESat satellite are colored in gray and the tracks of the airborne mission Operation IceBridge are shown in purple.
This print resolution image shows the accumulated change in the surface elevation of the Greenland ice sheet between 2003 and 2012.
This print resolution image shows the bedrock topography of Greenland with the ice sheet removed. Areas below sea level are shown in brown while areas above sea level are colored green. Yellow indicates regions at sea level. The blue/white flows indicate the direction and speed of the ice movement with slower moving ice is shown as shorter blue flow lines and faster shown as longer white flow lines.
This print resolution image shows the change in the surface elevation of the southeast region of the Greenland ice sheet between 2003 and 2012. In addition, blue/white flows indicate the direction and speed of the ice movement.
This print resolution image shows the southeast region of the Greenland Ice Sheet with a portion of the ice sheet remove to reveal the mountains along the coast. In addition, blue/white flows indicate the direction and speed of the ice movement.
This print resolution image shows the bedrock topography under the northeast region of the Greenland Ice Sheet. In addition, blue/white flows indicate the direction and speed of the ice movement. The camera view of this frame matches the image below showing the change in surface elevation.
This print resolution image shows the change in the surface elevation of the northeast region of the Greenland ice sheet between 2003 and 2012. In addition, blue/white flows indicate the direction and speed of the ice movement. The camera view of this frame matches the image above showing the bedrock topography under the ice sheet.
This print resolution image shows the bedrock topography under the Jakobshavn region of the Greenland Ice Sheet. In addition, blue/white flows indicate the direction and speed of the ice movement. The camera view of this frame matches the image below showing the change in surface elevation.
This print resolution image shows the change in the surface elevation of the Jakobshavn region of the Greenland ice sheet between 2003 and 2012. In addition, blue/white flows indicate the direction and speed of the ice movement. The camera view of this frame matches the image above showing the bedrock topography under the ice sheet.
This print resolution image shows the change in the surface elevation of the Jakobshavn region of the Greenland ice sheet between 2003 and 2012. In addition, blue/white flows indicate the direction and speed of the ice movement.
This print resolution image shows where the measurements were taken on the Greenland Ice sheet. The paths of the ICESat satellite are colored in gray and the tracks of the airborne mission Operation IceBridge are shown in purple.

This colorbar shows the colors and corresponding values for the accumulated change in the surface elevation of the ice sheet since 2003.

This colorbar shows the colors and corresponding values for the elevation of the bedrock topography.
This layer contains the background image without the date, colorbar or credit overlay.
This layer contains the colorbars for both the change in elevation over time as well as for the bedrock topography with transparency. In addition it contains the ending credits.
The date overlay with transparency
Credits
IceBridge Project Manager: Christy Hansen (Stinger Ghaffarian Technologies)
IceBridge Education and Outreach: George Hale (Telophase Corporation)
Spacecraft Models courtesy of Chris Meaney (Honeywell Technology Solutions)
Aircraft Model courtesy of Scott Hanger (NASA)
Glacier footage provided courtesy of James Balog, Extreme Ice Survey
earthvisiontrust.org and www.extremeicesurvey.org
Elevation change over Greenland provided courtesy of
Beata Csatho, University at Buffalo
Greenland ice sheet velocity data provided courtesy of
Eric Rignot (NASA/JPL)
Greenland bed elevation provided courtesy of Bamber, et al.,
A new bed elevation dataset for Greenland,
The Cryosphere, 7, 499-510, doi:10.5194/tc-7-499-2013, 2013.
Greenland Mapping Project (GIMP) Digital Elevation Model provided courtesy of
the BPRC Glacier Dynamics Research Group, Ohio State University
The Blue Marble data is courtesy of Reto Stockli (NASA/GSFC).
Please give credit for this item to:
NASA's Goddard Space Flight Center Scientific Visualization Studio
-
Visualizer
- Cindy Starr (Global Science and Technology, Inc.)
-
Animators
- Horace Mitchell (NASA/GSFC)
- Greg Shirah (NASA/GSFC)
-
Video editor
- Cindy Starr (Global Science and Technology, Inc.)
-
Narrator
- Jefferson Beck (USRA)
-
Producer
- Jefferson Beck (USRA)
-
Scientists
- Babonis Greg (University at Buffalo)
- J. L. Bamber (School of Geographical Sciences, University of Bristol, UK)
- Beata Csatho (University at Buffalo)
- J. A. Dowdeswell (University of Cambridge)
- Ian Howat (Ohio State University)
- R. T. W. L. Hurkmans (University of Bristol)
- P. Gogineni (Electrical Engineering and Computer Science, University of Kansas)
- J. A. Griggs (School of Geographical Sciences, University of Bristol)
- Jeremie Mouginot (University of California, Irvine)
- John Paden (University of Kansas)
- S. Palmer (University of Cambridge)
- Eric J. Rignot (NASA/JPL CalTech)
- Tony Schenk (University at Buffalo)
- Daniel Steinhage (Alfred Wegener Institute)
- Michael Studinger (NASA/GSFC)
-
Project support
- Ian Jones (ADNET Systems, Inc.)
- Laurence Schuler (ADNET Systems, Inc.)
- Lori Perkins (NASA/GSFC)
-
Writers
- Jefferson Beck (USRA)
- Cindy Starr (Global Science and Technology, Inc.)
Release date
This page was originally published on Tuesday, March 25, 2014.
This page was last updated on Wednesday, May 3, 2023 at 1:51 PM EDT.
Missions
This visualization is related to the following missions:Series
This visualization can be found in the following series:Datasets used in this visualization
-
GIMP Greenland DEM (Greenland Mapping Project (GIMP) Digital Elevation Model)
ID: 746 -
Greenland Ice Sheet Velocity
ID: 770Assembled from satellite radar interferometry data acquired during the International Polar Year (2008-2009). The satellites are Envisat Advanced Synthetic-Aperture Radar (ASAR), Advanced Land Observation System's (ALOS) Phase-Array L-band SAR (PALSAR), RADARSAT-1 SAR
See all pages that use this dataset -
Greenland bed elevation dataset by Bamber, et al., 2013
ID: 798 -
Annual Elevation of the Greenland Ice Sheet from 2003 through 2012 [ICESat and IceBridge]
ID: 819
Note: While we identify the data sets used in these visualizations, we do not store any further details, nor the data sets themselves on our site.
Related
- ID: 11988
 Produced Video
 - ID: 11841
 Produced Video
Used as a Source In
- ID: 12849
![Music: Contemporary Art Daily by Laurent Dury [SACEM]Complete transcript available.](/vis/a010000/a012800/a012849/Screen_Shot_2018-02-09_at_2.43.17_PM.png) Produced Video
Produced Video