Life Histories from Landsat: 25 Years in the Pacific Northwest Forest — North/South Tour
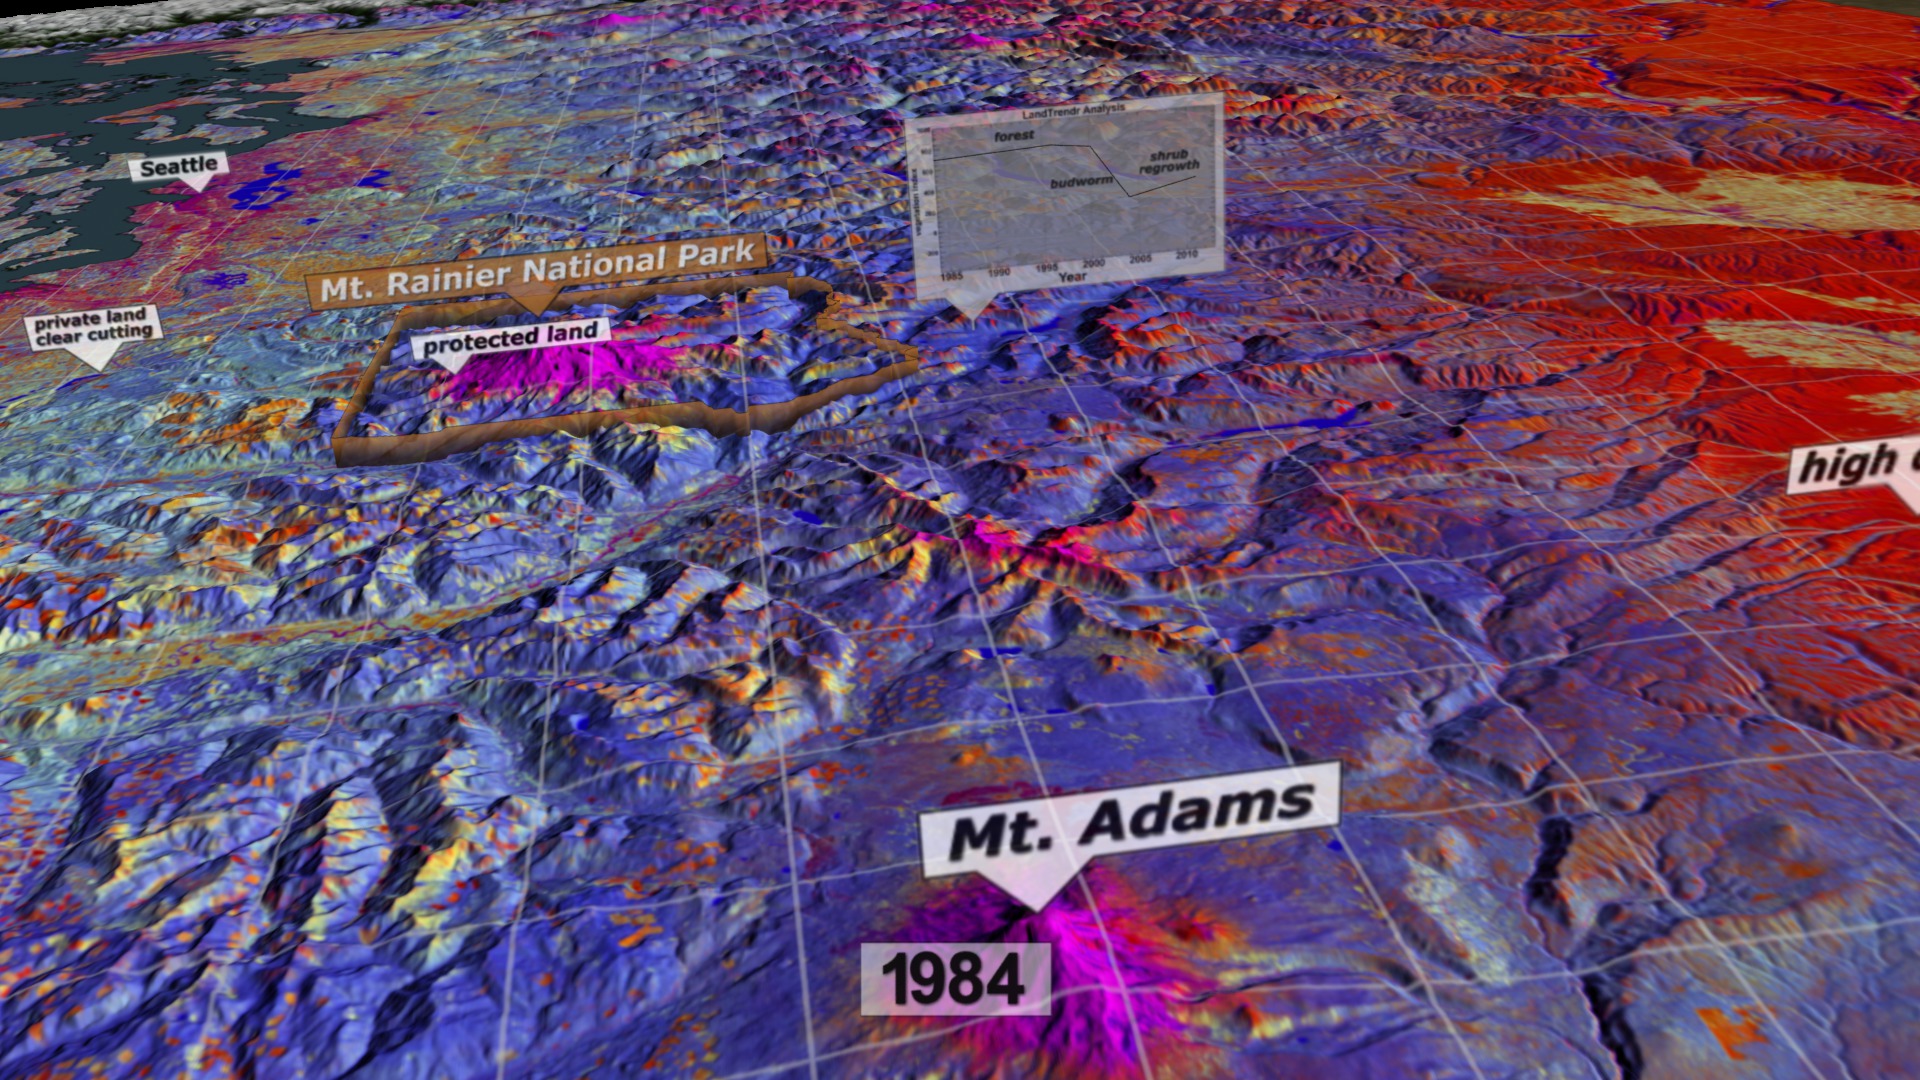
This visualization shows a sequence of Landsat-based data in the Pacific Northwest. There is one data set for each year representing an aggregate of the approximate peak of the growing season (around August). The data was created using a sophisticated algorithm called LandTrendr. LandTrendr analyzes 'stacks' of Landsat scenes, looking for statistical trends in the data and filtering out noise. The algorithm evaluated data from more than 1,800 Landsat Thematic Mapper images, nearly 1 Terabyte of raw imagery, to define the life histories of each of more than 336 million pixels on the landscape. The resulting trends identify periods of stability and change that are displayed as colors.
In these false color images, the colors represent types of land; for example, blue areas are forests; orange/yellow areas are agriculture; and, purple areas are urban. Each 'stack' is representative of a Landsat scene. There are 22 stacks stitched together to cover most of the U.S. Pacific Northwest. This processed data is used for science, natural resource management, and education.
We move in to the southwest corner of the data set near Redwood National Park and proceed on a slow tour through a portion of the data set. Time loops from 1984 through 2011 as we move. We move over to Mount Shasta, then up the Cascade Range, passing Crater Lake National Park, the Three Sisters, Mount Jefferson, Mount Hood, Mount Saint Helens, Mount Adams, Mount Rainier, Mount Baker, and the North Cascades National Park. Next we move west over Seattle and pass over Olympic National Park, then we head back south down the Willamette Valley back to Redwood National Park.
Don't miss this related narrated visualization
A tour of LandTrendr-processed Landsat data from Redwood National Park to Mount Shasta, up the Cascade Range, over to the Olympic Peninsula, and back down to Redwood National Park.

Print resolution still over Redwood National Park
Print resolution still over Mount Shasta
Print resolution still over Crater Lake National Park
Print resolution still over Three Sisters
Print resolution still over Mount Jefferson
Print resolution still over Mount Hood
Print resolution still over Mount Rainier National Park
Print resolution still over North Cascades National Park and Mount Baker
Print resolution still over Seattle
Print resolution still over Olympic National Park
Print resolution still over Salem
Print resolution still over Eugene
Print resolution still over Medford and the 2002 Biscuit Fire
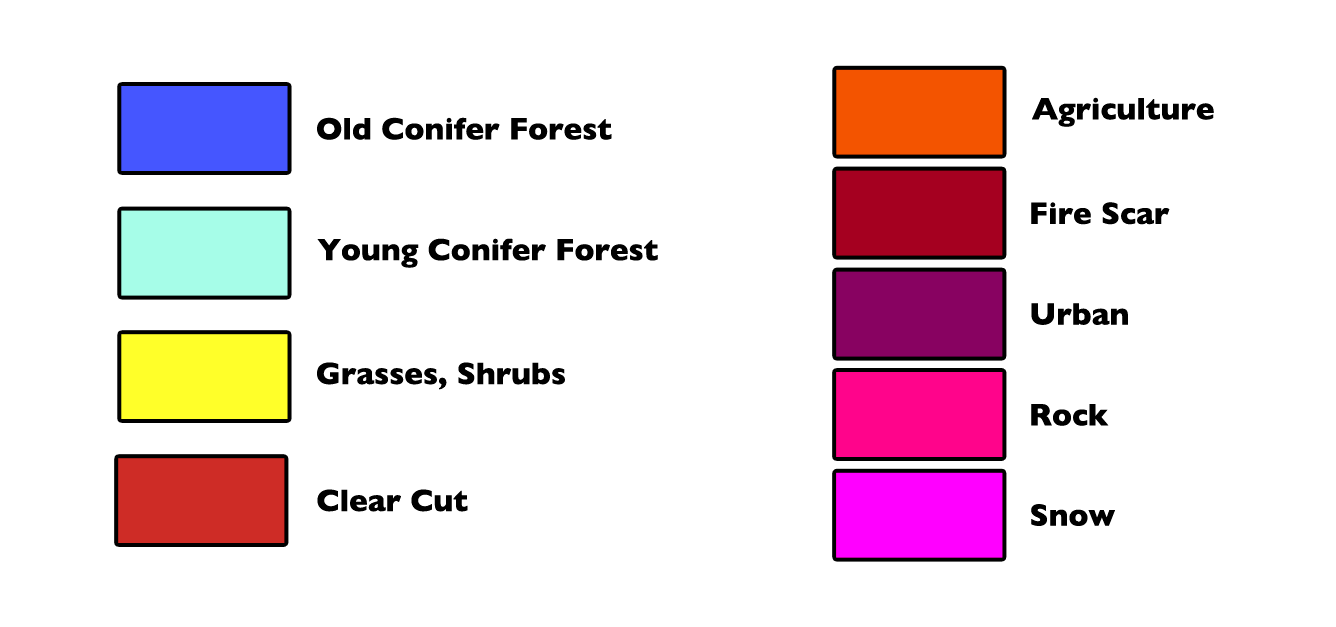
Color legend
Credits
Please give credit for this item to:
NASA's Goddard Space Flight Center Scientific Visualization Studio and the Laboratory for Applications of Remote Sensing in Ecology at Oregon State University
-
Animators
- Greg Shirah (NASA/GSFC)
- Alex Kekesi (Global Science and Technology, Inc.)
- Horace Mitchell (NASA/GSFC)
-
Producer
- Matthew R. Radcliff (USRA)
-
Scientists
- Robert Kennedy (Boston University)
- Zhiqiang Yang (Oregon State University)
- Justin Braaten (Oregon State University)
-
Writer
- Ellen T. Gray (ADNET Systems, Inc.)
Release date
This page was originally published on Friday, December 7, 2012.
This page was last updated on Wednesday, May 3, 2023 at 1:52 PM EDT.
Missions
This visualization is related to the following missions:Series
This visualization can be found in the following series:Datasets used in this visualization
-
DEM [SRTM: SIR-C]
ID: 481 -
BMNG (Blue Marble: Next Generation) [Terra and Aqua: MODIS]
ID: 508Credit: The Blue Marble data is courtesy of Reto Stockli (NASA/GSFC).
This dataset can be found at: http://earthobservatory.nasa.gov/Newsroom/BlueMarble/
See all pages that use this dataset -
LandTrendr
ID: 764The Landsat satellites have witnessed decades of change on the Earth's surface. Algorithms in LandTrendr
This dataset can be found at: http://landtrendr.forestry.oregonstate.edu
See all pages that use this dataset
Note: While we identify the data sets used in these visualizations, we do not store any further details, nor the data sets themselves on our site.
Related
- ID: 4013