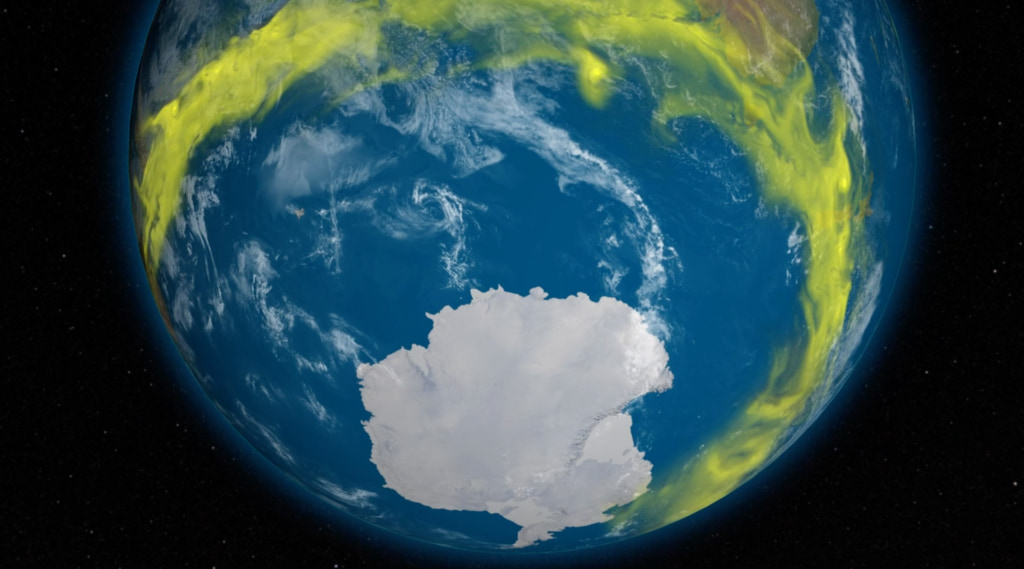
The Story of Ozone Depletion
The Antarctic ozone hole is caused by human-produced chlorine-containing chlorofluorocarbons (CFCs) and bromine-containing halons. These compounds had a variety of commercial uses, including hair sprays, refrigerants, and fire suppressants.
This story about the cause of ozone depletion was originally developed for the NASA hyperwall, where nine different animations can be shown simultaneously. The animations shown here are derived from the Goddard Earth Observing System (GEOS) model and cover two periods. The first period is from August through November 2004, and the second is from December 2004 through March 2005. The first period animations are shown on this page. The second period animations may be downloaded through the Download links below.
The chlorine compounds that destroy ozone have now been regulated under the international Montreal Protocol agreement. Because of this agreement, the ozone hole is projected to disappear around 2060-2070. NASA and the international community continue to monitor Antarctic ozone.
The ozone hole develops during the southern hemisphere winter and spring. Winter begins as the sun sets over Antarctic in the March-April period. Because of the absence of sunlight during the dark polar night, the lower stratosphere cools off. This animation shows temperature. In the August-September period, temperatures are below -70 degrees Celsius (203.15 degrees Kelvin) over a wide region.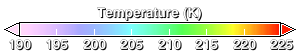
While levels of water vapor and nitric acid are very low over Antarctica, the temperatures are so cold that clouds can form at stratospheric altitudes (between 15 and 30 km). This animation shows condensed nitric acid. This nitric acid is found on small cloud particles in the stratosphere or polar stratospheric clouds (PSCs). The PSCs are a key ingredient to the Antarctic ozone hole.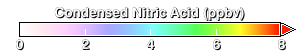
In addition to being very cold over Antarctica, the region is isolated by a strong jet stream that circles the continent in the stratosphere (the polar jet stream). Nitrous oxide (N₂O) is shown in this animation. Low concentrations of N₂O come from very high in the stratosphere to altitudes near 20 km, and then this air is isolated over Antarctica, forming a chemical "front," with low N₂O over Antarctica and higher levels over the southern mid-latitudes. Weather systems cause the front to undulate, but the jet stream acts as a containment vessel for the air over Antarctica.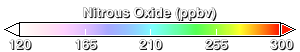
About 80% of the chlorine found at 20km over Antarctica comes from human-produced chlorine compounds. By the time this chlorine-rich air arrives over Antarctica it has been converted into two compounds: hydrochloric acid (HCl, this animation) and chlorine nitrate (ClONO₂, next animation). Normally, HCl and ClONO₂ do not directly affect ozone, but the presence of PSCs changes this. HCl and ClONO₂ react on the surfaces of PSCs to release chlorine into molecular chlorine (Cl₂).
Chlorine Nitrate (ClONO₂).
The chemical reactions that deplete Antarctic ozone are referred to as catalytic reactions. Chlorine monoxide (ClO, shown here) is directly involved with the destruction of ozone. More ClO results in more ozone loss. Another necessary ingredient for ozone loss is some visible sunlight (the energy needed for the catalytic reactions). As the sun rises over Antarctica during August and September, the Cl₂ from the HCl and ClONO₂ PSC reaction is broken apart by the visible light, and quickly converted to ClO. These ClO molecules destroy ozone while regenerating themselves to destroy more ozone molecules.
Because of the high levels of ClO occurring in August and September, ozone declines rapidly. Ozone is shown here. In July, ozone is relatively high over Antarctica, but by October it is nearly all gone.
As we move into the November period, temperatures have warmed over Antarctic (see above), the PSCs have disappeared (see nitric acid above), and the ClO has disappeared (see chlorine monoxide above). Ozone levels at 20 km have fallen to near zero (shown here). As we move into December, the low ozone over Antarctic is mixed into the middle latitudes by weather systems as the polar jet stream breaks down.
This animation shows gaseous nitric acid (HNO₃).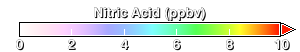
This animation shows potential vorticity. This animation and all the animations above are derived from a computer model that simulates the chemistry at an altitude of about 20 km. This model is constrained by the meteorology and the simulated variables are quite close to observations.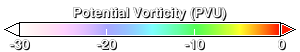
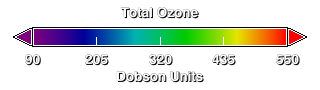
This animation shows the actual measured total amount of ozone found between the surface and space. This data was taken by the Total Ozone Mapping Spectrometer (TOMS) instrument aboard the NASA Earth Probe satellite. TOMS provided a global picture of total ozone each day.
Credits
Please give credit for this item to:
NASA/Goddard Space Flight Center
-
Scientist
- Paul Newman (NASA/GSFC)
-
Project support
- Eric Sokolowsky (Global Science and Technology, Inc.)
Release date
This page was originally published on Thursday, October 13, 2016.
This page was last updated on Tuesday, November 14, 2023 at 12:02 AM EST.
Series
This visualization can be found in the following series:Datasets used in this visualization
-
Total Ozone [Earth Probe: TOMS]
ID: 299 -
G5NR-Chem (Chemistry) [GEOS-5: Nature Run]
ID: 946
Note: While we identify the data sets used in these visualizations, we do not store any further details, nor the data sets themselves on our site.
Used as a Source In
- ID: 13807