Earth's Radiation Belts (cross-section)
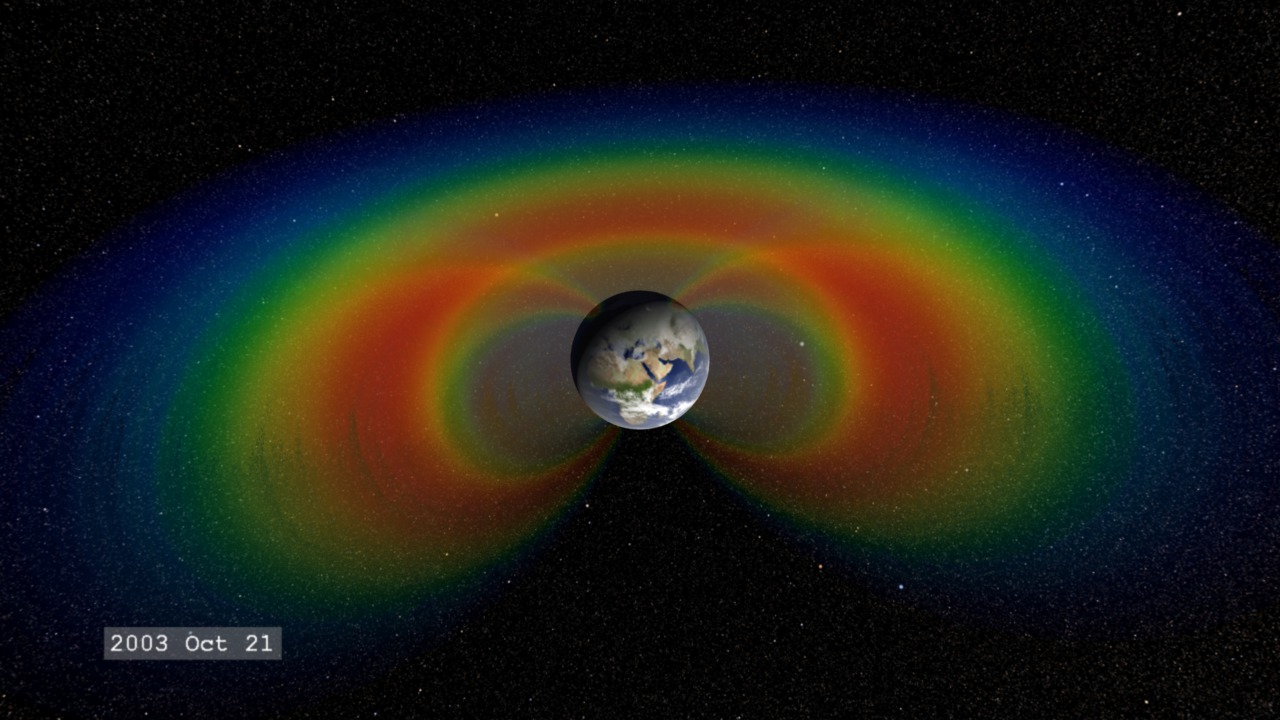
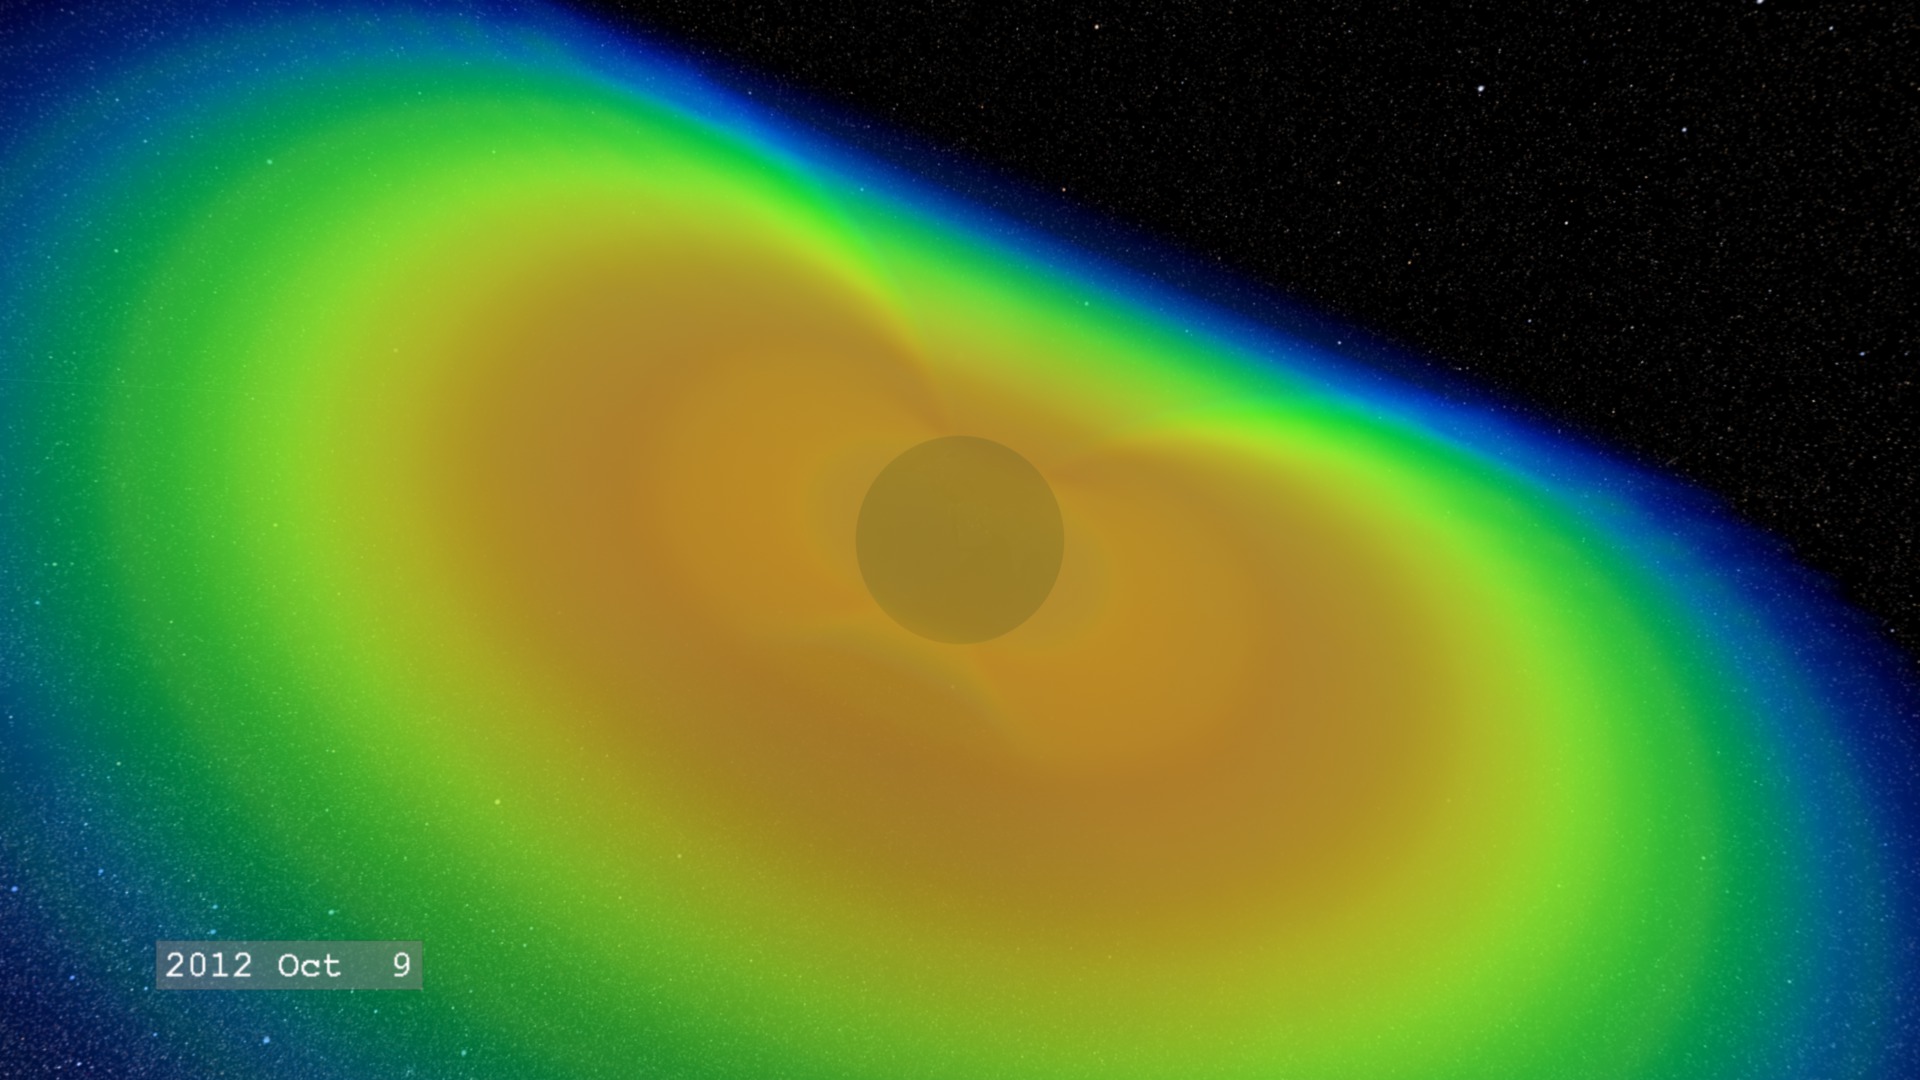
This is a simulation of the Earth's radiation belts. In this version, we've 'sliced' the belts open to provide a better view of their structure in cross-section. The non-cross-section view of the belts is Earth's Radiation Belts (side view)
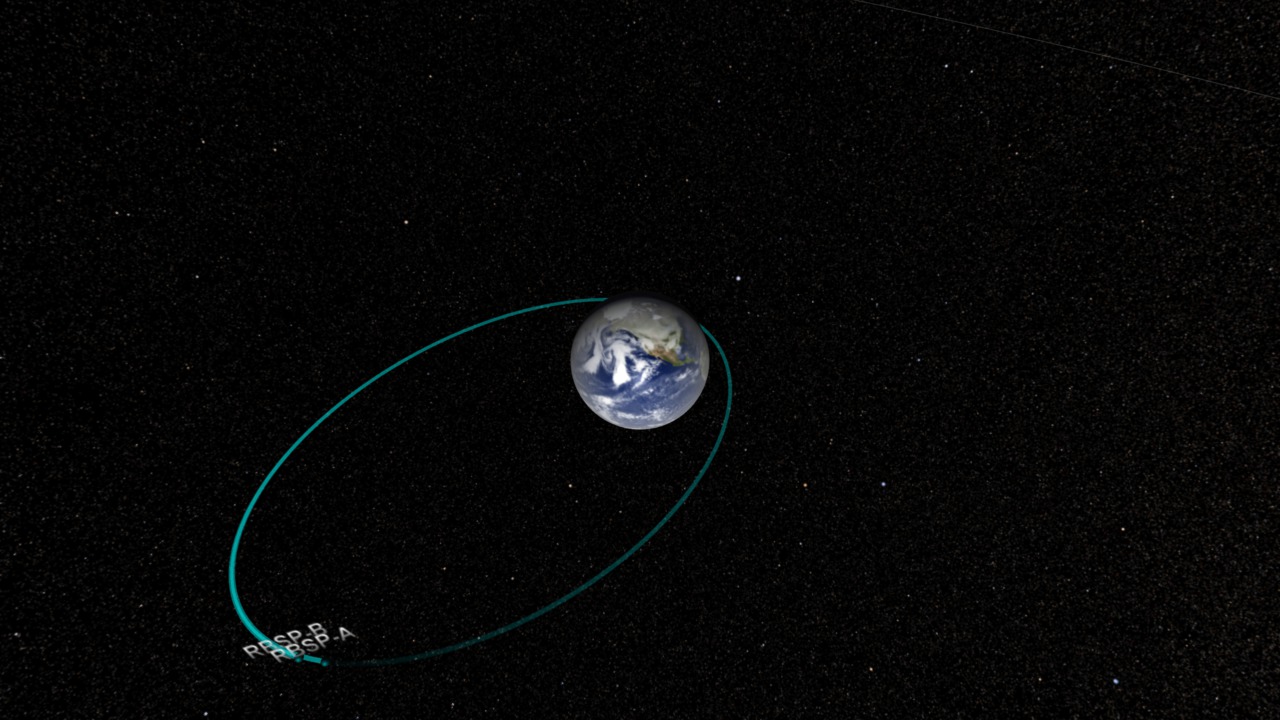
The Earth's magnetosphere is a very large magnetic structure around the Earth, and gets stretched into a large, teardrop-shaped configuration through its interaction with the solar wind. A number of the magnetic field lines, while they may originate on the Earth, do not connect back to the Earth, but connect into the magnetic field carried by the solar wind. However, near the Earth, the dipole component of the field is stronger than the solar wind field, and this allows all the magnetic field lines to connect back to the Earth, forming (approximately) the classic magnetic dipole configuration. In this region, lower energy electrons and ions, many from the Earth's ionosphere, can become trapped by the magnetic field to form the radiation belts.
The radiation belt model is constructed from particle flux information from the SAMPEX mission, with the flux mapped to constant L-shells of the Earth's dipole magnetic field. The model is anchored to the Earth's geomagnetic field axis, which is not perfectly aligned with the Earth's rotation axis. This creates a small wobble of the radiation belts with time, which can be seen in this visualization.
The data driving the radiation belt structure is time-shifted from the 2003 Halloween solar storms, a series of strong solar eruptions that began in late October 2003 and continued into the first week of November. During this time, the particle content of the belts change rapidly due to the variation in the energetic particle flux from the Sun buffeting the Earth's magnetosphere.
A cross-section view of the Earth's radiation belts.
Credits
Please give credit for this item to:
NASA/Goddard Space Flight Center Scientific Visualization Studio
-
Animator
- Tom Bridgman (Global Science and Technology, Inc.)
-
Producers
- Scott Wiessinger (USRA)
- Genna Duberstein (USRA)
-
Scientists
- David G. Sibeck (NASA/GSFC)
- Shrikanth G. Kanekal (NASA/GSFC)
Release date
This page was originally published on Tuesday, May 1, 2012.
This page was last updated on Wednesday, May 3, 2023 at 1:53 PM EDT.
Missions
This visualization is related to the following missions:Series
This visualization can be found in the following series:Datasets used in this visualization
-
[Solar Anomalous and Magnetospheric Particle Explorer (SAMPEX): HILT]
ID: 89This dataset can be found at: http://sunland.gsfc.nasa.gov/smex/sampex/
See all pages that use this dataset
Note: While we identify the data sets used in these visualizations, we do not store any further details, nor the data sets themselves on our site.
Related
- ID: 4006
 Visualization
 - ID: 3949
 Visualization
 - ID: 3951
- ID: 3942