Global Sea Surface Currents and Temperature
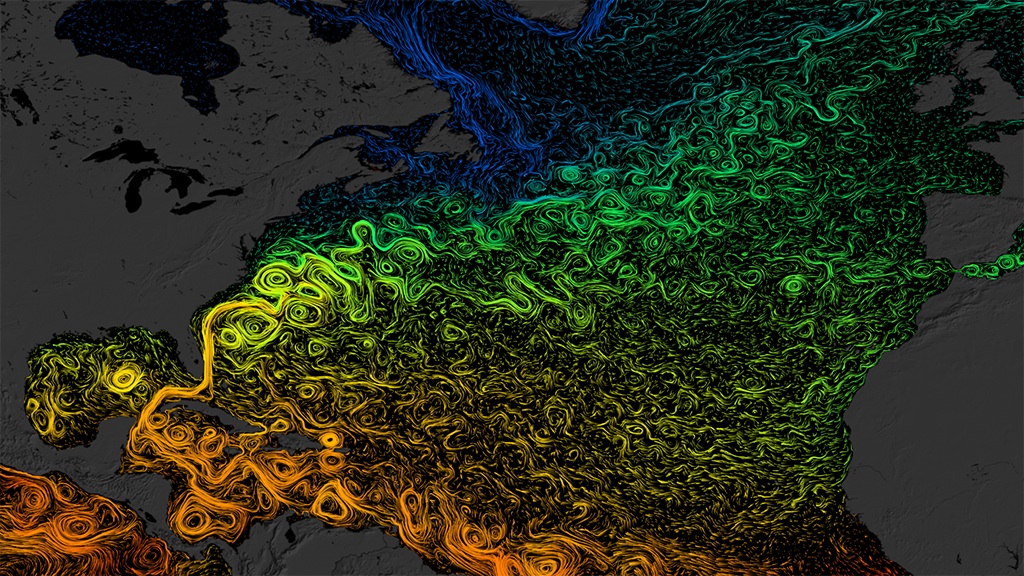
This visualization shows sea surface current flows. The flows are colored by corresponding sea surface temperature data. This visualization is rendered for display on very high resolution devices like hyperwalls or for print media.
This visualization was produced using model output from the joint MIT/JPL project entitled Estimating the Circulation and Climate of the Ocean, Phase II (ECCO2). ECCO2 uses the MIT general circulation model (MITgcm) to synthesize satellite and in-situ data of the global ocean and sea-ice at resolutions that begin to resolve ocean eddies and other narrow current systems, which transport heat and carbon in the oceans. The ECCO2 model simulates ocean flows at all depths, but only surface flows are used in this visualization.
Global sea surface currents colored by temperature. These are the assembled (contiguous) versions of the animation. There are several resolutions to choose from, some are cropped for various purposes. The 6840x3420 version is the complete, full resolution visualization at the appropriate 2x1 aspect ratio and has not been cropped or resized. The time range for these visualizations is from 2007-03-25T12:00Z to 2008-03-03T12:00Z.

A cropped region in the Pacific illustrating the distribution of the actual flow vector data points relative to the flow curves. The white dots represent locations where the ECCO2 model defines the ocean current directions. Locations in between those locations are interpolated.
A cropped region in the Atlantic illustrating the distribution of the actual flow vector data points relative to the flow curves. The white dots represent locations where the ECCO2 model defines the ocean current directions. Locations in between those locations are interpolated. Notice the irregular distribution of grid points (e.g., bright spot near the center). This is due to the advanced cube-sphere distribution of the data points. The bright spot is one of the cube-sphere corners.
Full resolution ECCO2 flow field illustrating the distribution of the actual flow vector data points relative to the flow curves. The white dots represent locations where the ECCO2 model defines the ocean current directions. Locations in between those locations are interpolated.
Sea surface currents and temperatures cropped, scaled, and diced for a 5x3 hyperwall.
Date and time information for each frame can be found here. Individual cut-up frames and movie files are available for download.
Sea Surface currents of the northern Atlantic Ocean. This version was produced for a 5x3 hyperwall.
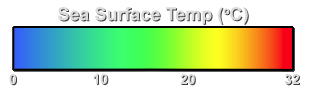
Sea surface temperature color bar (blue is 0 degrees C, green is 10-20 degrees C, yellow is about 25 degrees C, red is 32 degrees C)
This visualization shows the sea surface currents and temperatures in the eastern Pacific Ocean.
Credits
Please give credit for this item to:
NASA/Goddard Space Flight Center Scientific Visualization Studio
-
Animators
- Greg Shirah (NASA/GSFC)
- Horace Mitchell (NASA/GSFC)
- Eric Sokolowsky (Global Science and Technology, Inc.)
-
Project support
- Eric Sokolowsky (Global Science and Technology, Inc.)
-
Producer
- Michael Starobin (HTSI)
-
Scientists
- Hong Zhang (UCLA)
- Dimitris Menemenlis (NASA/JPL CalTech)
Release date
This page was originally published on Friday, March 16, 2012.
This page was last updated on Sunday, April 14, 2024 at 10:07 PM EDT.
Missions
This visualization is related to the following missions:Datasets used in this visualization
-
GTOPO30 Topography and Bathymetry
ID: 274 -
ECCO2 (ECCO2 High Resolution Ocean and Sea Ice Model)
ID: 707
Note: While we identify the data sets used in these visualizations, we do not store any further details, nor the data sets themselves on our site.
Related
- ID: 10953
 Produced Video
Sources
- ID: 30701
 Hyperwall Visual
Used as a Source In
- ID: 12738
![Watch this video on the NASA Goddard YouTube channel.Complete transcript available.Music credits: 'Micro Currents' by Jean-Patrick Voindrot [SACEM], 'Sink Deep' by Andrew Michael Britton [PRS], David Stephen Goldsmith [PRS], Mikey Rowe [PRS] from Killer Tracks.](/vis/a010000/a012700/a012738/LARGE_MP4-12738_RapidIntensification_large.00084_print.jpg) Produced Video
Produced Video