Mapping Diseases
The print-resolution still images were created for the February 2012 issue of The Scientist (print and online). In an article in the same issue, NASA scientist Assaf Anyamba explains how he can predict diseases with remote-sensing data.
The data used are:
1. NDVI is an index that quantifies the photosynthetic capacity of vegetation. It is derived from visible and near-infrared reflectance measurements made by Advanced Very High Resolution Radiometer (AVHRR) sensors onboard NOAA's polar orbiting satellites (in this case NOAA-17). Taken as time series measurements, NDVI indicates the response of vegetation to seasonal and interannual variations in climate.
2. SST data are a blend of direct observations from ships, buoys, satellite imagery also from National Oceanic and Atmospheric Administration (NOAA) Advanced Very High Resolution Radiometer (AVHRR) instruments, and SSTs simulated by sea-ice cover. The monthly optimum interpolated fields were derived by a linear interpolation of the weekly fields to daily fields, and then averaging daily values over a month.
All anomaly fields (as shown here) are derived by subtracting the monthly values from the respective long-term monthly means.

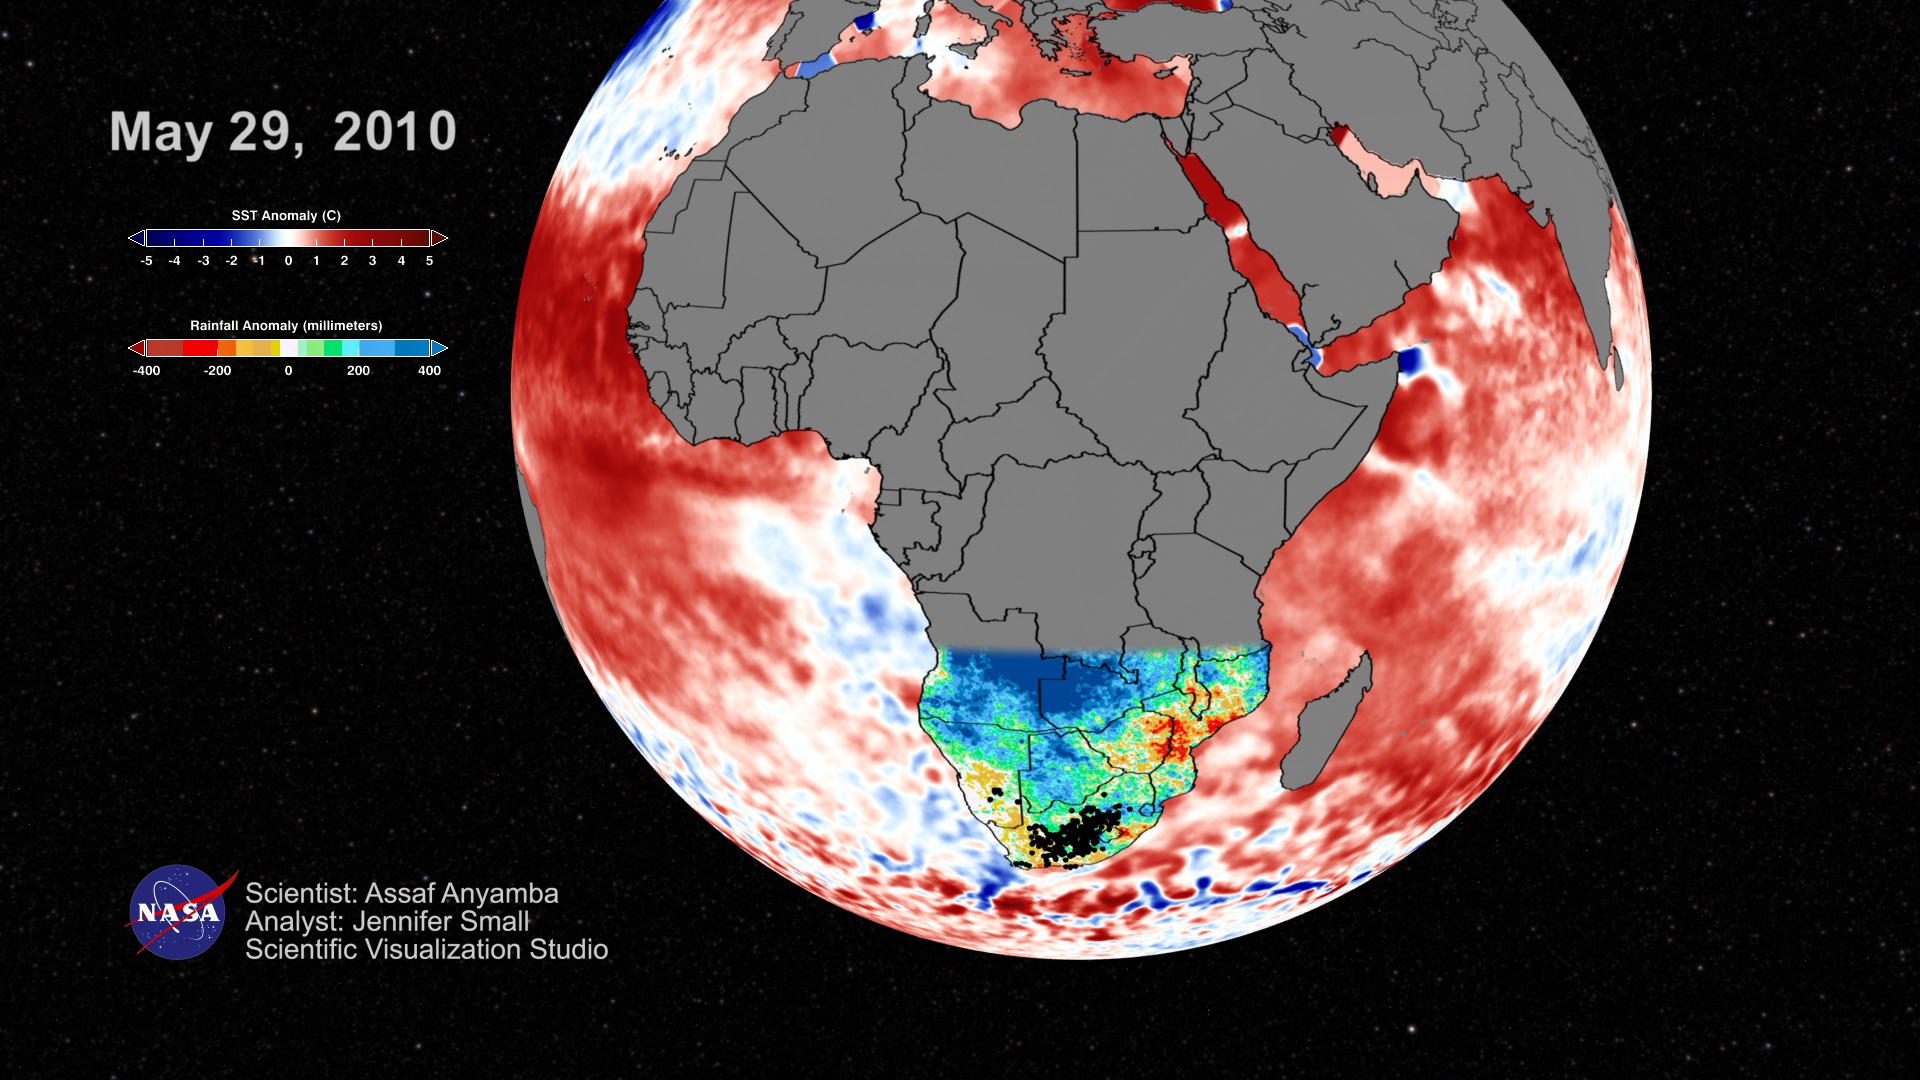
This map shows combined anomalies in Sea-Surface Temperatures(SST)(oceans) and Normalized Difference Vegetation Index (NDVI) (land), observed globally for January 2007. The unusually high Sea Surface Temperatures (red) sustained in the western equatorial Indian Ocean and the central and eastern equatorial Pacific Ocean since the fall of 2006 caused an anomalous growth in vegetation (green-purple), in Eastern Africa due to persistent and heavy rainfall. Above normal rainfall combined with growth in vegetation created ideal ecological conditions for the emergence of mosquitoes that spread Rift Valley fever.
Sea Surface Temperature (SST) Anomaly color scale.
Normalized Difference Vegetation Index (NDVI) Anomaly percent color scale.
Sea Surface Temperature (SST) Anomalies map osbserved globally in January 2007 (layer with transparency).
Global map of continents (layer with transparency).
Normalized Difference Vegetation Index (NDVI) anomaly map observed globably in January 2007 (layer with transparency).
Global map of coastal outlines (layer with transparency).
Close view of East Africa region with SST and NDVI anomaly data observed in January 2007.
Coastal outlines of East Africa close view (layer with transparency).
Credits
Please give credit for this item to:
NASA/Goddard Space Flight Center Scientific Visualization Studio
-
Animators
- Helen-Nicole Kostis (USRA)
- Greg Shirah (NASA/GSFC)
-
Scientists
- Assaf Anyamba (USRA)
- Jennifer Small (SSAI)
Release date
This page was originally published on Friday, April 13, 2012.
This page was last updated on Wednesday, May 3, 2023 at 1:53 PM EDT.
Papers used in this visualization
Datasets used in this visualization
-
NDVI [NOAA: AVHRR]
ID: 426 -
Sea Surface Temperature [NOAA: AVHRR]
ID: 427
Note: While we identify the data sets used in these visualizations, we do not store any further details, nor the data sets themselves on our site.
Related
- ID: 3807
 Visualization