A newer version of this visualization is available.
Sea Ice Yearly Minimum 1979-2011 (SSMI data)
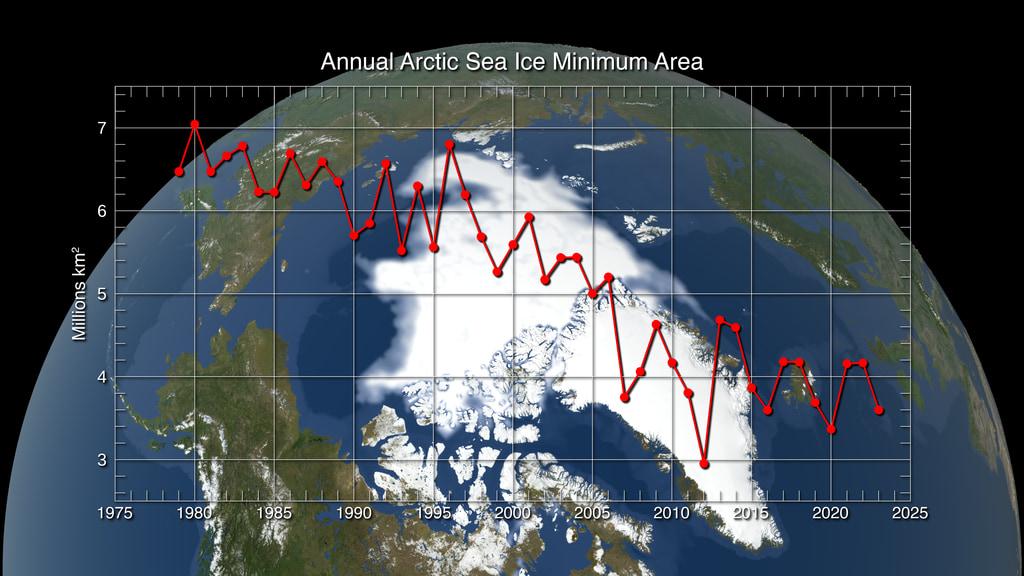
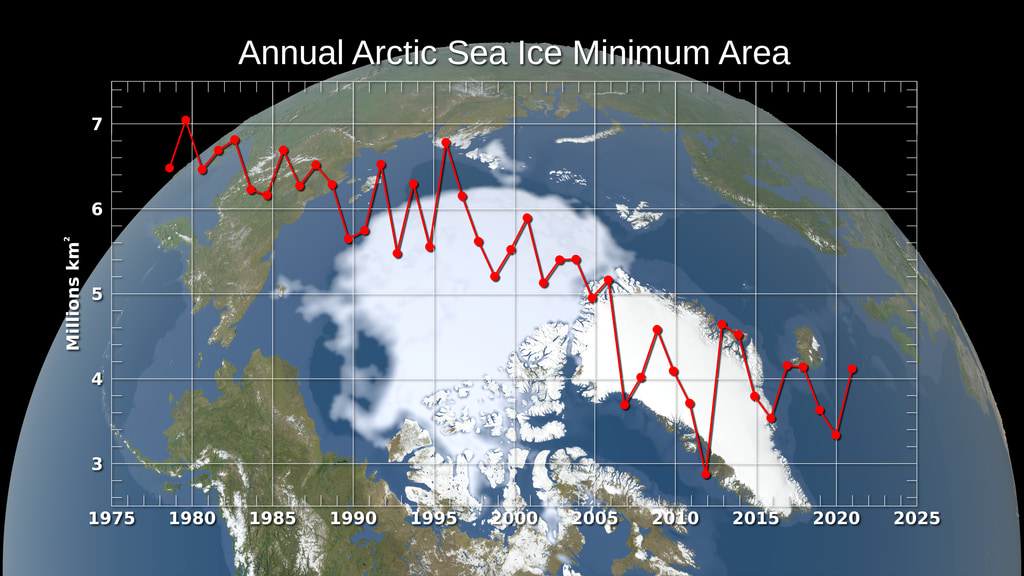
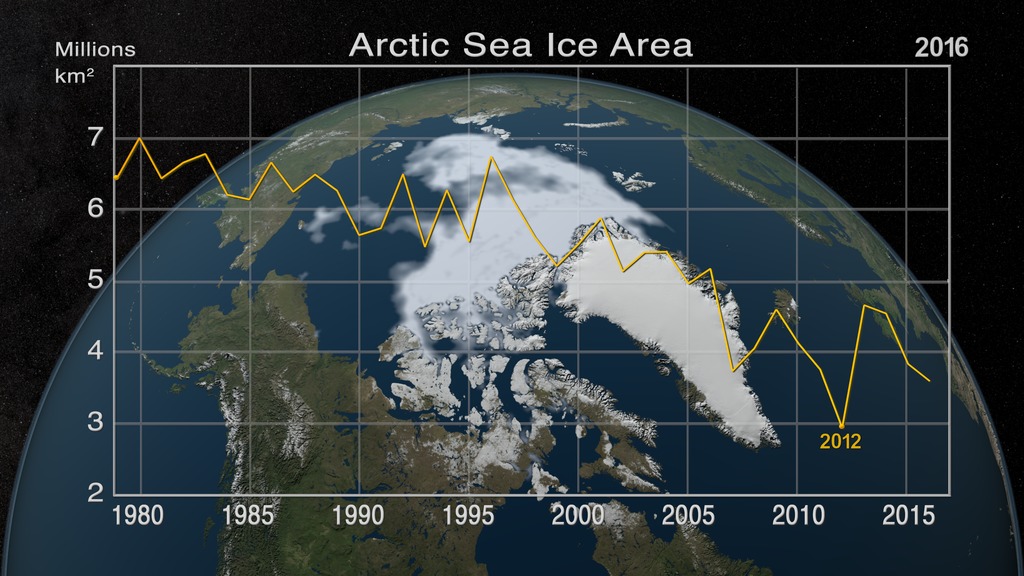
The continued significant reduction in the area covered by the summer sea ice is a dramatic illustration of the pronounced impact increased global temperatures are having on the Arctic regions. There has also been a significant reduction in the relative amount of older, thicker ice. Satellite-based passive microwave images of the sea ice cover have provided a reliable tool for continuously monitoring changes in the Arctic ice cover since 1979. The ice parameters derived from satellite ice concentration data that are most relevant to climate change studies are sea ice extent and ice area. This visualization shows the annual September minimum sea ice area in the background and a graph of the ice area values foreground. The ice area provides the total area actually covered by sea ice which is useful for estimating the total volume and therefore mass, given the average ice thickness. For more information about these ice datasets, see The Journal of Geophysical Research VOL. 113, C02S07, doi:10.1029/2007JC004257, 2008
This visualization shows the annual Arctic sea ice minimum from 1979 to 2011. A graph is overlaid that shows the area in million square kilometers for each year's minimum day. The '1979','2007', and '2011' data points are highlighted on the graph.
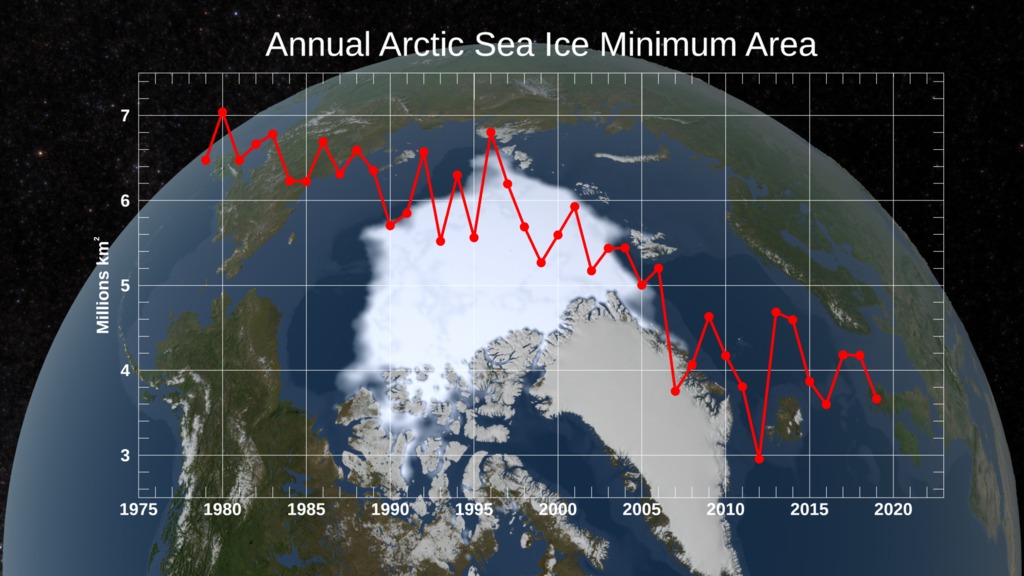
The Annual Arctic Sea Ice Minimum Area from 1979 to 2011 with the a graph overlay.
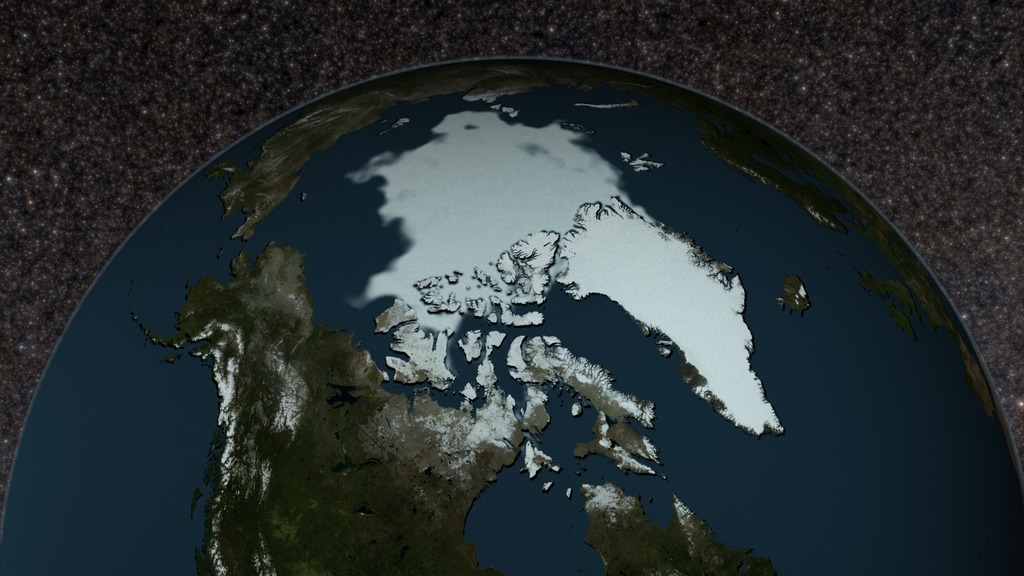
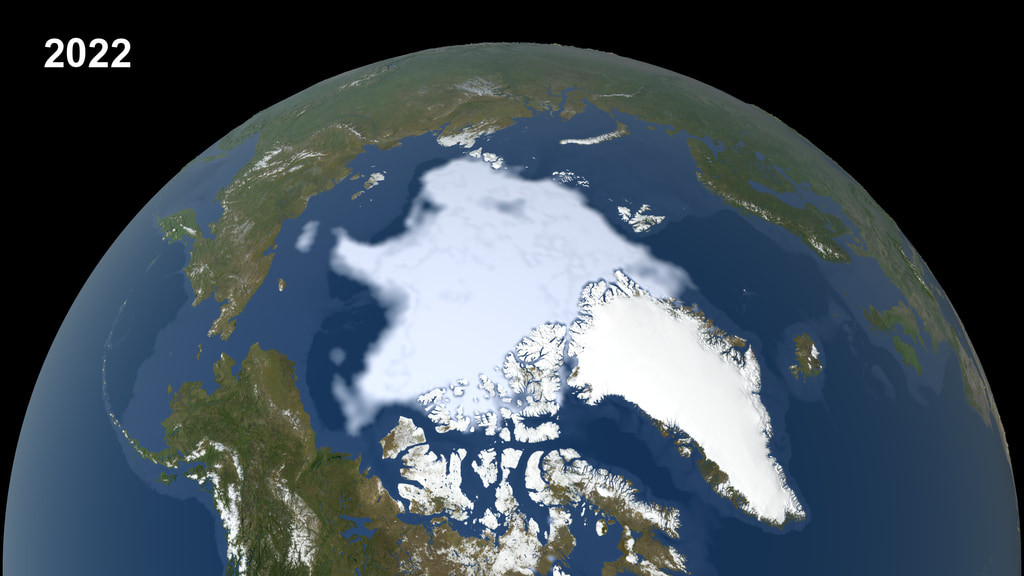
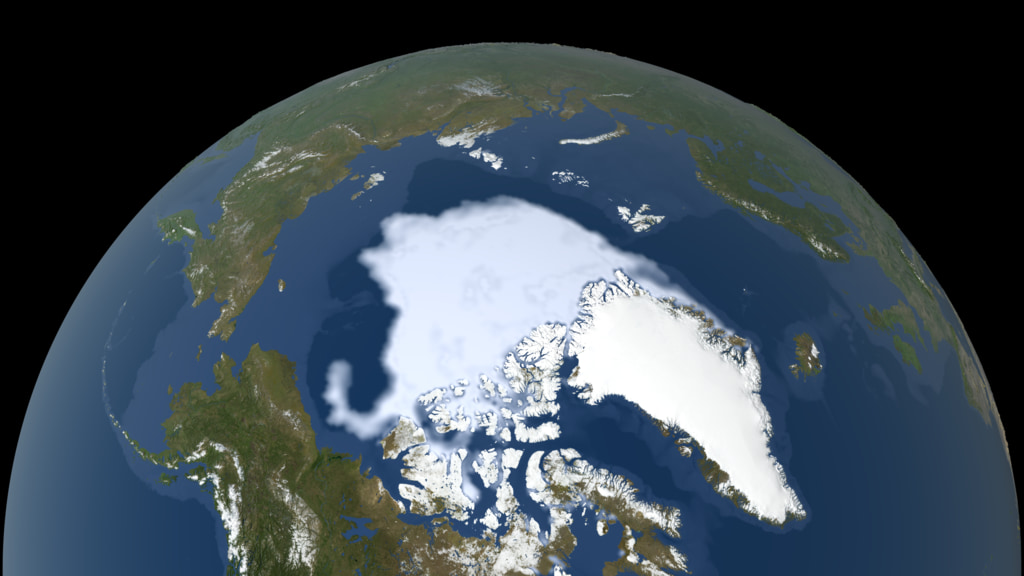
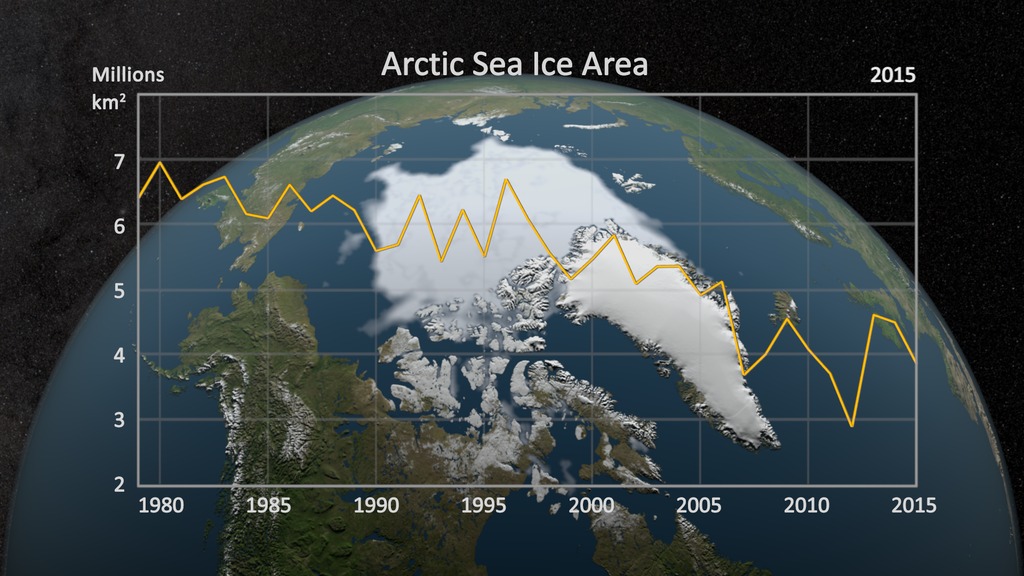
Minimum Annual Sea Ice Sequence from 1979 through 2011 without the graph overlay.
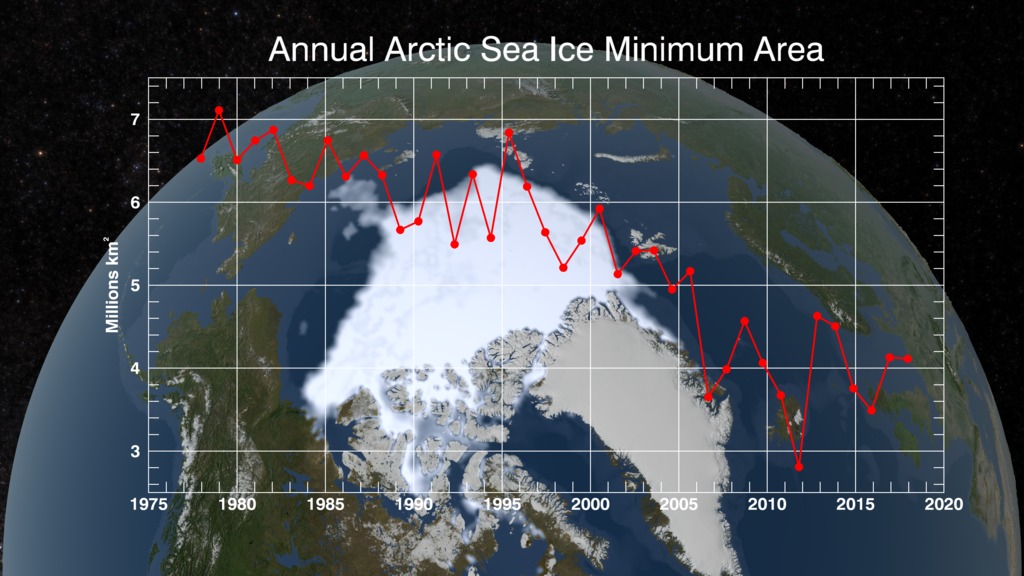
The graph overlay with transparency

An image of the 2011 arctic sea ice minimum with the graph overlay at various resolutions.
An image of the 2011 arctic sea ice minimum at various resolutions.
Credits
Please give credit for this item to:
NASA/Goddard Space Flight Center Scientific Visualization Studio
Thanks to Rob Gerston (GSFC) for providing the data.
-
Visualizer
- Cindy Starr (Global Science and Technology, Inc.)
-
Animators
- Lori Perkins (NASA/GSFC)
- Greg Shirah (NASA/GSFC)
-
Scientist
- Josefino Comiso (NASA/GSFC)
-
Project support
- James W. Williams (Global Science and Technology, Inc.)
Release date
This page was originally published on Friday, December 2, 2011.
This page was last updated on Sunday, November 12, 2023 at 10:06 PM EST.
Series
This visualization can be found in the following series:Datasets used in this visualization
-
[DMSP: SSM/I]
ID: 11Defense Meteorological Satellite Program Special Sensor Microwave Imager
See all pages that use this dataset -
Sea Ice Concentration [DMSP: SSM/I]
ID: 290 -
Comiso's September Minimum Sea Ice Concentration
ID: 540
Note: While we identify the data sets used in these visualizations, we do not store any further details, nor the data sets themselves on our site.
Related
- ID: 4592
 Visualization
 - ID: 11081
 Produced Video
Newer Versions
- ID: 5170
 Visualization
 - ID: 5036
 Visualization
 - ID: 5002
 Visualization
 - ID: 4867
 Visualization
 - ID: 4786
 Visualization
 - ID: 4686
 Visualization
 - ID: 4573
 Visualization
 - ID: 4435
 Visualization