Global Fire Observations and MODIS NDVI
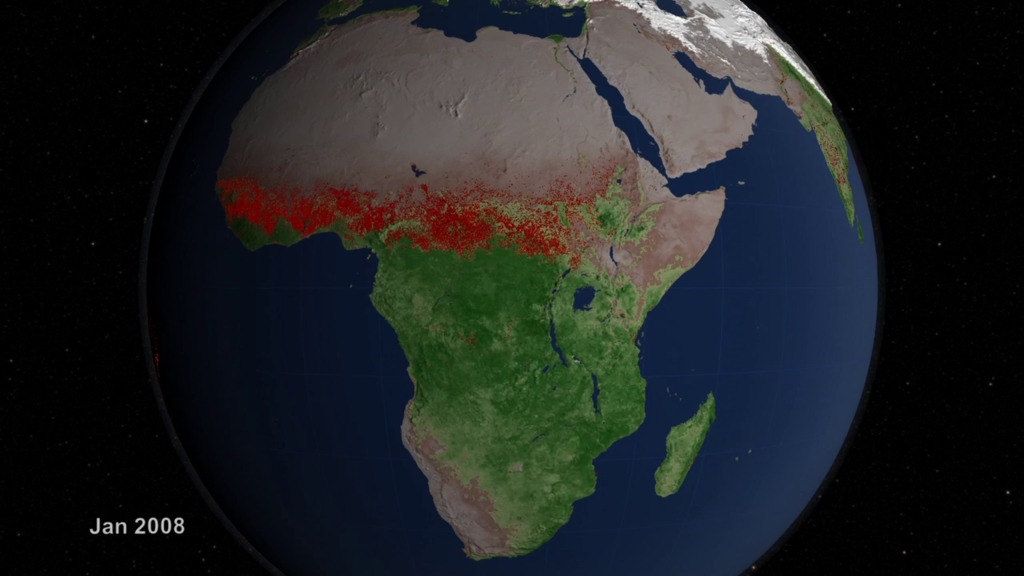
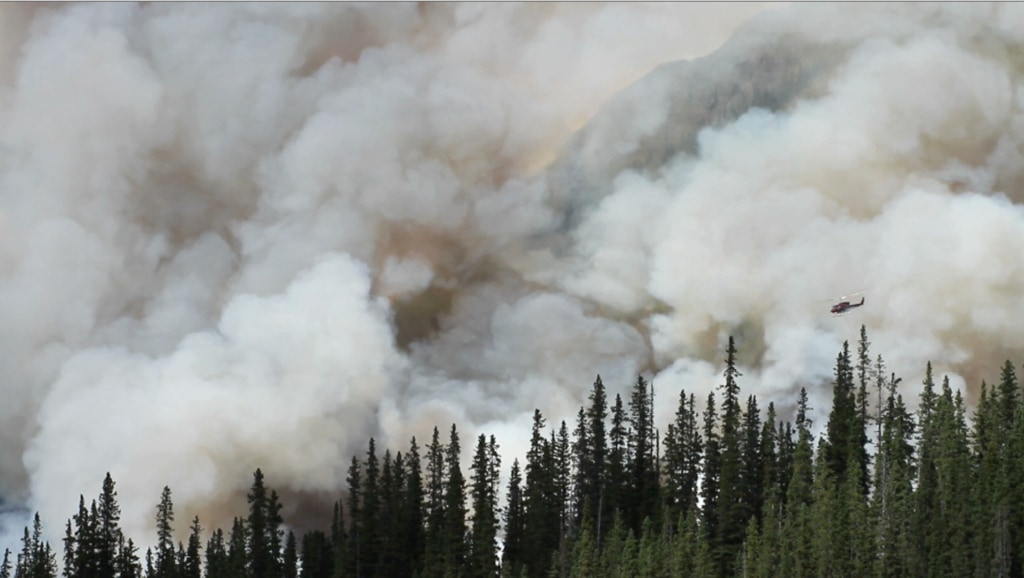
This visualization leads viewers on a narrated global tour of fire detections beginning in July 2002 and ending July 2011. The visualization also includes vegetation and snow cover data to show how fires respond to seasonal changes. The tour begins in Australia in 2002 by showing a network of massive grassland fires spreading across interior Australia as well as the greener Eucalyptus forests in the northern and eastern part of the continent. The tour then shifts to Asia where large numbers of agricultural fires are visible first in China in June 2004, then across a huge swath of Europe and western Russia in August, and then across India and Southeast Asia through the early part of 2005. It moves next to Africa, the continent that has more abundant burning than any other. MODIS observations have shown that some 70 percent of the world's fires occur in Africa alone. In what's a fairly average burning season, the visualization shows a huge outbreak of savanna fires during the dry season in Central Africa in July, August, and September of 2006, driven mainly by agricultural activities but also by the fact that the region experiences more lightning than anywhere else in the world. The tour shifts next to South America where a steady flickering of fire is visible across much of the Amazon rainforest with peaks of activity in September and November of 2009. Almost all of the fires in the Amazon are the direct result of human activity, including slash-and-burn agriculture, because the high moisture levels in the region prevent inhibit natural fires from occurring. It concludes in North America, a region where fires are comparatively rare. North American fires make up just 2 percent of the world's burned area each year. The fires that receive the most attention in the United States, the uncontrolled forest fires in the West, are less visible than the wave of agricultural fires prominent in the Southeast and along the Mississippi River Valley, but some of the large wildfires that struck Texas earlier this spring are visible.
More information on the Fire Information for Resource Management System (FIRMS) is available at http://maps.geog.umd.edu/firms/.
Fire observations from around the world taken over nearly 10 years are shown in this visualization of NASA satellite data.
For complete transcript, click here.
This video is also available on our YouTube channel.
A 10 year sequence of global fires as seen by NASA's MODIS instruments.
Colortable showing MODIS fire pixels. The number colorized is MODIS MCD14ML T21 Brightness temperature minus the T31 Brightness temperature.

Colortable showing MODIS' 16 Day Composite NDVI

Australia on December 15, 2002.
Asia and Europe on September 15, 2004
South America on September 15, 2009
The United States on July 15, 2011.
This frame set is designed for the Science On a Sphere venues. It contains global fire and vegetation data from July 1, 2002 through July 30, 2011.
Credits
Please give credit for this item to:
NASA/Goddard Space Flight Center Scientific Visualization Studio
-
Animators
- Lori Perkins (NASA/GSFC)
- Greg Shirah (NASA/GSFC)
-
Producer
- Jefferson Beck (USRA)
-
Scientists
- Chris Justice (University of Maryland)
- Louis Giglio (SSAI)
- Luigi Boschetti (University of Maryland College Park)
-
Writer
- Adam P Voiland (Wyle Information Systems)
Release date
This page was originally published on Tuesday, October 18, 2011.
This page was last updated on Tuesday, November 14, 2023 at 12:01 AM EST.
Missions
This visualization is related to the following missions:Series
This visualization can be found in the following series:Datasets used in this visualization
-
Fire Location [Terra and Aqua: MODIS]
ID: 496Credit: Fire location data courtesy of MODIS Rapid Response Project (NASA/GSFC and University of Maryland - http://rapidfire.sci.gsfc.nasa.gov)
See all pages that use this dataset -
NDVI (Normalized Difference Vegetation Index (NDVI)) [Terra and Aqua: MODIS]
ID: 633 -
Ice and Snow (Pixel Reliability (value=2)) [Terra and Aqua: MODIS]
ID: 714
Note: While we identify the data sets used in these visualizations, we do not store any further details, nor the data sets themselves on our site.
Related
- ID: 10851
 Produced Video
Used as a Source In
- ID: 31171
 Hyperwall Visual
 - ID: 12667
 Produced Video