Iceland's Eyjafjallajökull Volcanic Ash Plume May 6-8, 2010 - Stereoscopic Version
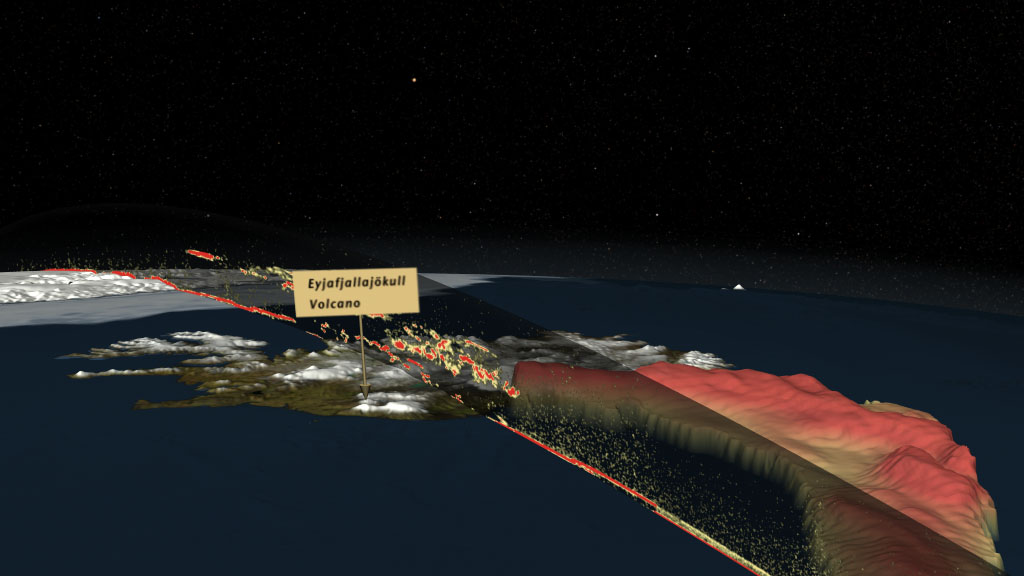
During April and May, 2010, the Eyjafjallajökull volcano on Iceland's southern coast erupted, creating an expansive ash cloud that disrupted air traffic throughout Europe and across the Atlantic. This animation shows the flow of this ash cloud for three days in early May on an hourly basis as sensed from a geostationary satellite. The ash cloud heights were determined using an approach developed by NOAA/NESDIS/STAR for the next generation of Geostationary Operational Environmental Satellite (GOES-R). Data from EUMETSAT's Spinning Enhanced Visible and Infrared Imager (SEVIRI) was used as a proxy for GOES-R Advanced Baseline Imager (ABI) data. This data is shown intersecting with the CALIPSO Parallel Attenuated Backscatter curtain on May 6th.
In this page the visualization content is offered in two different modes to accommodate stereoscopic systems as: Left and Right Eye separate and Left and Right Eye side-by-side combined on the same frame.
This set provides stereoscopic visualization content (Left and Right Eye separate) of the composite animation including the foreground, star background and date overlay.
This set provides stereoscopic visualization content (Left and Right Eye side by side combined on the same frame) of the composite animation including the foreground, star background and date overlay.
The right eye of the above visualization with a colorbar.
This video is also available on our YouTube channel.

This set provides stereoscopic visualization content (Left and Right Eye separate) for the foreground animation with transparency.
A still image of the ash plume on May 6, 2010 at 14:00 UT
This set provides stereoscopic visualization content (Left and Right Eye separate) of the star background without transparency. These frames are rendered wider than the standard size to allow them to be shifted to alter the stereo separation of the background plane.
The date overlay with transparency

The colorbar used for the ash plume height
Credits
Please give credit for this item to:
NASA/Goddard Space Flight Center Scientific Visualization Studio
-
Visualizer
- Cindy Starr (Global Science and Technology, Inc.)
-
Animator
- Horace Mitchell (NASA/GSFC)
-
Video editor
- Victoria Weeks (HTSI)
-
Producer
- Michael Starobin (HTSI)
-
Scientists
- Michael J. Pavolonis (NOAA/NESDIS/STAR)
- Charles Trepte (NASA/LaRC)
- Jason Trackett (SSAI)
- Justin Sieglaff (Cooperative Institute for Meteorological Satellite Studies)
- Zhaoyan Liu (National Institute of Aerospace)
Release date
This page was originally published on Thursday, October 21, 2010.
This page was last updated on Tuesday, November 14, 2023 at 12:00 AM EST.
Missions
This visualization is related to the following missions:Datasets used in this visualization
-
Parallel Attenuated Backscatter 532 [CALIPSO: CALIOP]
ID: 700 -
Ash Detection and Height [EUMETSAT: Spinning Enhanced Visible and Infrared Imager (SEVIRI)]
ID: 703
Note: While we identify the data sets used in these visualizations, we do not store any further details, nor the data sets themselves on our site.
Related
- ID: 10837
 Produced Video