2007 Greenland Melt Season Study
The Greenland ice sheet has been the focus of attention recently because of increasing melt in response to regional climate change. Several different remote sensing data products have been used to study surface and near-surface melt characteristics of the Greenland ice sheet for the 2007 melt season when record melt extent and runoff occurred. Here, MODIS daily land surface temperature and a special diurnal melt product, derived from QuikSCAT scatterometer data, measure the evolution of melt on the ice sheet. Although these daily products are sensitive to different geophysical features, they show excellent correspondence when surface melt is present.
This animation displays these two geophysical data products of the Greenland ice sheet side-by-side, showing MODIS data on the left side and QuikSCAT data on the right. The 2007 melt season is shown twice. In the first sequence, MODIS surface temperature is compared with several categories of QuikSCAT melt between March 15th and October 13th, 2010. During this sequence, active melt detected by QuikSCAT is shown in light blue, reduced melt is medium blue, and completed melt is dark blue. For the MODIS, surface temperature is shown with the color scale — red indicates a surface temperature greater than -1 degree Celsius. As MODIS shows warmer surface temperature as the melt season progresses, QuikSCAT consistently identifies the corresponding melt.
In the second sequence, the MODIS and QuikSCAT melted regions of the ice sheet were accumulated during the melt season. QuikSCAT captures melt earlier, and then melt is detected by MODIS shortly afterward at a higher spatial resolution. The final result (frame) shows the seasonal melt extent which was consistently delineated by both sensors. The cross-verification of these independent measurements, by two different instruments on different satellites, provides a higher confidence level in the melt observations, reducing the uncertainty in climate assessment of Greenland melt.
This animation shows the correspondence between the MODIS melt and the QuikSCAT melt over Greenland during 2007.

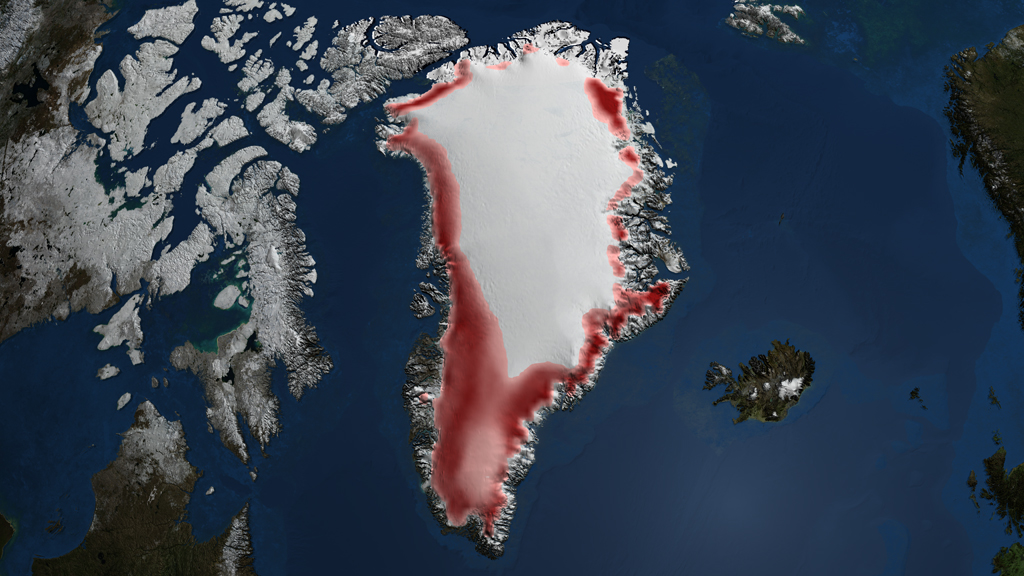
Image comparing the total accumulated melt from both MODIS and QuikSCAT on August 8, 2007.
Credits
Please give credit for this item to:
NASA/Goddard Space Flight Center Scientific Visualization Studio
-
Visualizer
- Cindy Starr (Global Science and Technology, Inc.)
-
Scientists
- Dorothy Hall (NASA/GSFC)
- Son Nghiem (NASA/JPL CalTech)
Release date
This page was originally published on Friday, July 23, 2010.
This page was last updated on Tuesday, November 14, 2023 at 12:00 AM EST.
Datasets used in this visualization
-
QuikSCAT Detection of Snowmelt on the Greenland Ice Sheet [QuikSCAT: SeaWinds]
ID: 695 -
Land Surface Temperature [Terra: MODIS]
ID: 696
Note: While we identify the data sets used in these visualizations, we do not store any further details, nor the data sets themselves on our site.
Related
- ID: 10880
 Produced Video