Amazon Basin Monthly GRACE Data
This visualization displays monthly GRACE data in the Amazon basin. GRACE (Gravity Recovery and Climate Experiment) measures mass distribution and in this instance is used to demonstrate water storage and movement in the basin. Warmer colors like red and yellow reveal areas with greater mass, or more water, while cooler colors like blue and green indicate areas with lesser mass, or less water.
Animation cycling through the monthly Amazon basin GRACE data.
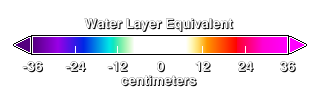
Color bar for previous animation.
Credits
Please give credit for this item to:
NASA/Goddard Space Flight Center Scientific Visualization Studio
-
Animator
- Adam Martin (UMBC)
-
Producer
- Paul Reddish (Free Spirit Films)
-
Scientists
- John C. Ries (University of Texas)
- Scott Luthcke (NASA/GSFC)
Release date
This page was originally published on Thursday, January 14, 2010.
This page was last updated on Wednesday, May 3, 2023 at 1:54 PM EDT.
Missions
This visualization is related to the following missions:Datasets used in this visualization
-
K-band Intersatellite Range Rate [Gravity Recovery and Climate Experiment (GRACE): KBR Horn]
ID: 598This dataset can be found at: http://www.nasa.gov/home/hqnews/2004/sep/HQ_04286_GRACE.html
See all pages that use this dataset
Note: While we identify the data sets used in these visualizations, we do not store any further details, nor the data sets themselves on our site.