Hourly Total Precipitation from the GEOS-5 Model
This animation portrays the hourly flow of precipitation around the world. The animation was created using data from the GEOS-5 atmospheric model on the cubed-sphere, run at 14-km global resolution for 30-days. For more information on the GEOS-5, see http://gmao.gsfc.nasa.gov/systems/geos5 . For more information on the cubed-sphere work, see http://sivo.gsfc.nasa.gov/cubedsphere_overview.html.
This animation displays the intensity of precipitation as it flows around the globe, showing heavy precipitation in orange/yellow, medium in blue/green and light precipitation in purple.

An image of precipitation over the Pacific Ocean and North America.
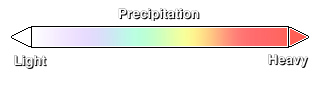
Color bar for the precipitation
Credits
Please give credit for this item to:
NASA/Goddard Space Flight Center Scientific Visualization Studio
The Blue Marble data is courtesy of Reto Stockli (NASA/GSFC).
-
Visualizer
- Cindy Starr (Global Science and Technology, Inc.)
-
Producer
- Michelle Williams (UMBC)
-
Scientists
- Matthew Rodell (NASA/GSFC)
- William Putman (NASA/GSFC)
Release date
This page was originally published on Thursday, October 8, 2009.
This page was last updated on Sunday, November 12, 2023 at 10:01 PM EST.
Series
This visualization can be found in the following series:Datasets used in this visualization
-
GEOS-5 Cubed-Sphere (GEOS-5 Atmospheric Model on the Cubed-Sphere)
ID: 663The model is the GEOS-5 atmospheric model on the cubed-sphere, run at 14-km global resolution for 30-days. GEOS-5 is described here http://gmao.gsfc.nasa.gov/systems/geos5/ and the cubed-sphere work is described here http://sivo.gsfc.nasa.gov/cubedsphere_overview.html.
See all pages that use this dataset
Note: While we identify the data sets used in these visualizations, we do not store any further details, nor the data sets themselves on our site.