A newer version of this visualization is available.
Close view of 2008 Arctic Sea Ice from AMSR-E
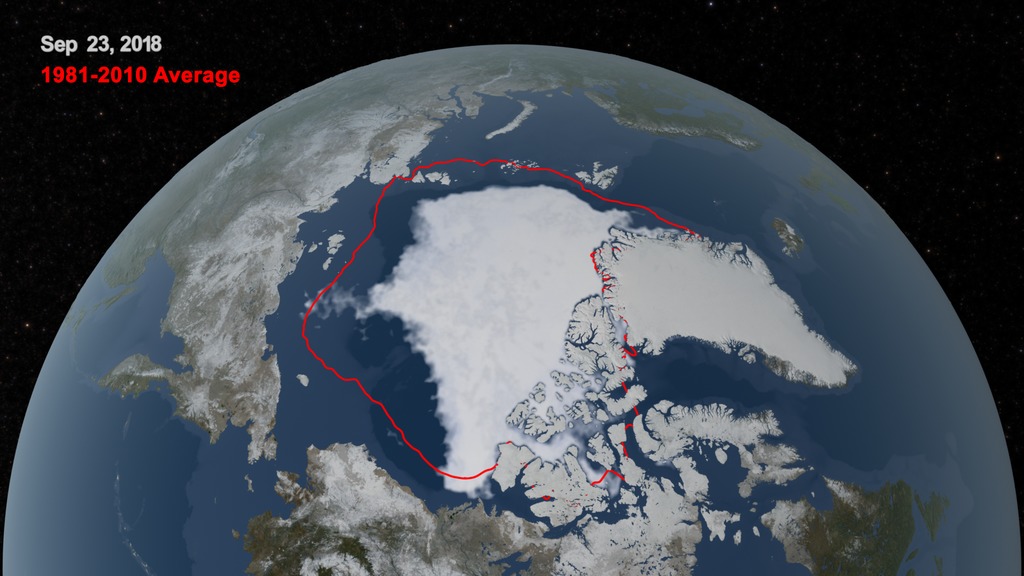
Sea ice is frozen seawater floating on the surface of the ocean. Some sea ice is semi-permanent, persisting from year to year, and some is seasonal, melting and refreezing from season to season. The sea ice cover reaches its minimum extent at the end of each summer and the remaining ice is called the perennial ice cover.
The AMSR-E instrument on the Aqua satellite acquires high resolution measurements of the 89 GHz brightness temperature near the poles. Because this is a passive microwave sensor which is not so sensitive to atmospheric effects, this sensor is able to observe the entire polar region every day, even through clouds and snowfall. The false color of the sea ice, derived from the AMSR-E 6.25 km 89 GHz brightness temperature, highlights the fissures or divergence areas in the sea ice cover by warm brightness temperatures (in blue) while cold brightness temperatures, shown in brighter white, represent consolidated sea ice. The sea ice edge identifies areas containing at least 15% ice concentration in the three-day moving average of the AMSR-E 12.5 km sea ice concentration data.
The animations below show the continuos motion of the Arctic sea ice during 2008 up to the point at which the Arctic sea ice reached its minimum extent. The 2008 minimum extent of 4.52 sq km (1.74 sq miles) is the second lowest extent recorded since 1979.
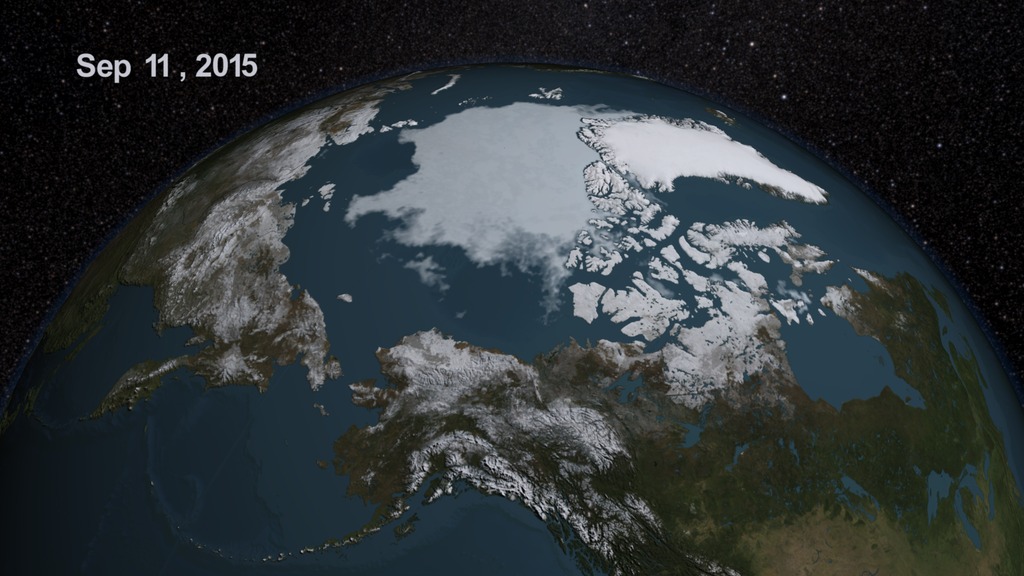
The animation of Arctic sea ice from January 1 through September 12, identified by NSIDC as the minimum extent for 2008. This animation has a two second hold on September 12, 2008. The date is displayed in the upper left corner.
The animation of Arctic sea ice from January 1 through September 12, the date identified by NSIDC as the minimum extent for 2008. This animation has a two second hold on September 12, 2008.
The date sequence with an alpha channel.

Image of Arctic sea ice on March 10, 2008 when the sea ice reached the annual maximum extent of 15.21 million square kilometers (5.87 million square miles).
Image of the Arctic sea ice on September 9, 2008.
Image of Arctic sea ice on September 12, 2008.
Image of Arctic sea ice on September 13, 2008
Image of Arctic sea ice on September 14 2008
Credits
Please give credit for this item to:
NASA/Goddard Space Flight Center Scientific Visualization Studio
The Blue Marble Next Generation data is courtesy of Reto Stockli (NASA/GSFC).
-
Visualizer
- Cindy Starr (Global Science and Technology, Inc.)
-
Producer
- Jefferson Beck (UMBC)
Release date
This page was originally published on Sunday, September 14, 2008.
This page was last updated on Wednesday, May 3, 2023 at 1:55 PM EDT.
Datasets used in this visualization
-
Daily L3 6.25 km 89 GHz Brightness Temperature (Tb) [Aqua: AMSR-E]
ID: 236 -
Sea Ice Concentration (Daily L3 12.5km Tb, Sea Ice Concentration, and Snow Depth) [Aqua: AMSR-E]
ID: 237
Note: While we identify the data sets used in these visualizations, we do not store any further details, nor the data sets themselves on our site.
Newer Versions
- ID: 4684
 Visualization
 - ID: 4355
 Visualization