Pacific Anthropogenic Aerosol Optical Depth (AOD) in 2003
According to measurements taken with a satellite instrument, vast quantities of industrial aerosols and smoke from biomass burning in East Asia and Russia are traveling from one side of the globe to another. Explosive economic growth in Asia has profound implications for the atmosphere worldwide. Data collected by a NASA satellite shows a dense blanket of polluted air over the Northwestern Pacific. This brown cloud is a toxic mix of ash, acids, and airborne particles from car and factory emissions, as well as from low-tech polluters like coal-burning stoves and from forest fires. This image generated by data from NASA's instrument called MODIS (Moderate Resolution Imaging Spectroradiometer) onboard the Terra satellite demonstrates how large and pervasive this transport phenomenon is across vast areas. China's exports fill shelves around the world, but according to a new NASA research paper, China also heavily exports pollution. This week, space agency scientists reveal how Chinese industrialization and Russian forest fires in combination with pollution transported eastward from Europe send roughly 18 teragrams - almost 40 billion pounds-of pollution aerosols into the atmosphere over the Northwestern Pacific every year. The MODIS instrument on NASA's Terra satellite has been tracking the particulate pollution for more than seven years, gathering data as most of it drifted east across the Pacific Ocean. About 4.5 teragrams of particulate pollution each year could reach the western boundary of North America, which is about 15% of local emissions of particulate pollutants from the U.S. and Canada. In the last two decades, China has more than doubled its pollution production. This boom may be contributing to substantial changes in climate and weather in places far from the origin of the particulates. Never in human history-anywhere-has there been industrial growth like that in modern China. But with fast growth comes unintended consequences, and from space evidence of those consequences is starting to emerge. The research relies on measurements of something called "aerosol optical thickness". It's a quantitative measurement about how well a slice of atmosphere transmits light. The greater the value of optical thickness for a given location, the less light of a particular wavelength can pass through it. Measurements of aerosol optical thickness describe quantities of tiny particles in a given volume. By measuring how much light can penetrate a region of atmosphere across a variety of wavelengths, scientists can make certain inferences about the quantity and type of particles blocking that light. This visualization shows the seasonal variations of transport of pollution aerosols across the North Pacific. The East Asian airstream carries its largest pollution loading in spring and smallest in summer and fall. With heavy concentrations of aerosols represented by shades of brown, scientists can track the origins and distribution of the particles as they travel in the atmosphere. The sequence also shows a trail of substantial aerosol concentrations from a variety of sources. These sources include heavy industrial activity in East Asia associated with high population density represented in this sequence by gradations of black covering the land surface, and intense Russian forest fires in high latitudes.
This movie shows a three day moving average of anthropogenic aerosols over the Pacific in 2003. Human population is shown in blue/purple. On May 9, 2003 a heavy pollution plume is being transported over the Pacific from Asia to North America.
This movie shows the same three day moving average of particulate pollution optical depth and human population. It does not have the date overlaid.

In this picture, heavy aerosol concentrations appear in shades of brown, with darker shades representing greater concentrations. Areas of purple on the land surface represent human population. Notice how heavy aerosol production and dense population areas correspond. Also notice how there are dense patches of red points in East Asia. These correspond with intense forest fires, sending vast quantities of aerosols into the atmosphere. Although this image gives the impression that the fires and plumes of aerosols may not be connected, in fact they are. There's a direct relationship between those fire point and the brown patches appearing to the East.
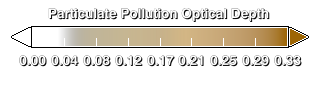
Colorbar - particulates are measured in micrometers.
April 25, 2003 With heavy concentrations of aerosols represented by shades of brown, scientists can track the origins and distribution of the particles as they travel in the atmosphere.
May 31, 2003 The MODIS instrument on NASA's Terra satellite has been tracking the particulate pollution for more than seven years, gathering data as most of it drifted east across the Pacific Ocean. About 4.5 teragrams of particulate pollution each year could reach the western boundary of North America, which is about 15% of local emissions of particulate pollutants from the U.S. and Canada.
Nov 7, 2003 Areas in purple on the land surface represent human population. Notice how heavy aerosol production and dense population areas correspond.
Dec 25, 2003 In the last two decades, China has more than doubled its pollution production. This boom may be contributing to substantial changes in climate and weather in places far from the origin of the particulates.
Credits
Please give credit for this item to:
NASA/Goddard Space Flight Center Scientific Visualization Studio
-
Animator
- Lori Perkins (NASA/GSFC)
-
Producer
- Michael Starobin (HTSI)
-
Scientist
- Hongbin Yu (JCET UMBC)
-
Writer
- Michael Starobin (HTSI)
Release date
This page was originally published on Thursday, March 13, 2008.
This page was last updated on Wednesday, May 3, 2023 at 1:55 PM EDT.
Missions
This visualization is related to the following missions:Series
This visualization can be found in the following series:Datasets used in this visualization
-
Anthropogenic Aerosol Optical Depth [Terra: MODIS]
ID: 596
Note: While we identify the data sets used in these visualizations, we do not store any further details, nor the data sets themselves on our site.