Aqua/AIRS Global Carbon Dioxide
Although originally designed to measure atmospheric water vapor and temperature profiles for weather forecasting, data from the Atmospheric Infrared Sounder (AIRS) instrument on NASA's Aqua spacecraft are now also being used by scientists to observe atmospheric carbon dioxide. Scientists from NASA; the National Oceanic and Atmospheric Administration; the European Center for Medium-Range Weather Forecasts; the University of Maryland, Baltimore County; Princeton University, Princeton, New Jersey; and the California Institute of Technology (Caltech), Pasadena, Calif., are using several different methods to measure the concentration of carbon dioxide in the mid-troposphere (about eight kilometers, or five miles, above the surface). This visualization shows Aqua/AIRS mid-tropospheric carbon dioxide from July 2003. Low concentrations, 360 ppm, are shown in blue and high concentrations, 385 ppm, are shown in red. Notice that despite carbon dioxide's high degree of mixing, the regional patterns of atmospheric sources and sinks are still apparent in mid-troposphere carbon dioxide concentrations. This pattern of high carbon dioxide in the Northern Hemisphere (North America, Atlantic Ocean, and Central Asia) is consistent with model predictions.
For more information on AIRS, visit the AIRS Project Web Site: http://airs.jpl.nasa.gov. The AIRS data products are available at http://daac.gsfc.nasa.gov/AIRS/index.shtml.
This visualization shows global carbon dioxide from July 2003 at 8 km. Low concentrations are shown in blue and high concentrations are shown in red.

The Aqua/Airs instrument reads a low region of carbon dioxide over the Himalayas.
High levels of carbon dioxide are detected over the Asian Pacific Rim.
This image shows the global monthly average Carbon Dioxide in July 2003 as seen by Aqua/AIRS.
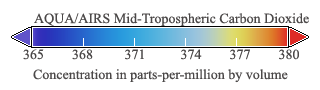
Carbon Dioxide Colortable
Credits
Please give credit for this item to:
NASA/Goddard Space Flight Center and NASA/Jet Propulsion Laboratory
Scientific Visualization Studio
-
Animators
- Lori Perkins (NASA/GSFC)
- Greg Shirah (NASA/GSFC)
-
Scientists
- Tom Pagano (NASA/JPL CalTech)
- Edward Olsen (NASA/JPL CalTech)
Release date
This page was originally published on Sunday, December 30, 2007.
This page was last updated on Wednesday, May 3, 2023 at 1:55 PM EDT.
Series
This visualization can be found in the following series:Datasets used in this visualization
-
[Aqua: AIRS]
ID: 3For more information on the Atmospheric Infrared Sounder, click http://www-airs.jpl.nasa.gov/
See all pages that use this dataset
Note: While we identify the data sets used in these visualizations, we do not store any further details, nor the data sets themselves on our site.