Sequence of Clouds, Snow Cover, Sea Ice, Sea Surface Temperature and Biosphere
This animation is part of an NSF-funded, international project, Exploring Time. The two-hour television special, broadcast on the Discovery Channel in the spring of 2007, explores how the world changes over different timescales ... from billionths of seconds to billions of years. This animation portrays a variety of remotely sensed data elements at different temporal resolutions.
Initially, the animation shows cloud cover in motion over North America in half-hour increments from Nov. 26 to Dec. 7, 2005. The temporal pace quickens to show a 5-day moving average of daily MODIS snow cover along with daily AMSR-E sea ice from Dec. 7, 2005 to Mar. 15, 2006. As the view swings south over the Gulf of Mexico, the AMSR-E Sea Surface Temperature reveals warming ocean temperatures from March through August, 2006. As it passes over the Atlantic Ocean, the biosphere fades into view, showing both chlorophyll concentration in the ocean along with Normalized Difference Vegetation Index over the land areas. The biosphere animates over time while the view pans over northern Africa and Europe, showing data collected from September 2002 through February 2006.
This program was also broadcast in Japan through a partnership with the NHK international broadcasting service and in France through a partnership with the ARTE television network.
This animation shows snow cover, sea ice, clouds, sea surface temperature and biosphere while the view moves from North America across the Atlantic Ocean to Northern Africa and Europe.

This image shows snow cover, sea ice and clouds over North America on 12/5/2005.
This images shows sea surface temperature over the Gulf of Mexico on 6/16/2006.
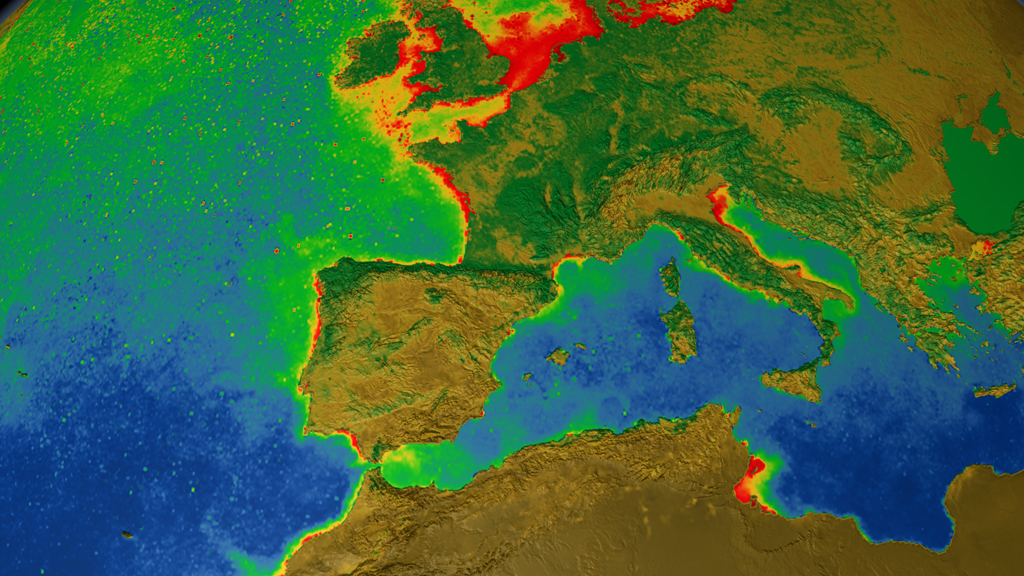
This image shows the biosphere over Europe and northern Africa on 11/2/2005.
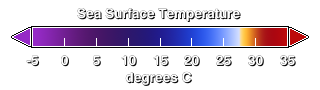
This color bar denotes the values of the sea surface temperature.

This color bar denotes the values of the chlorophyll concentration.
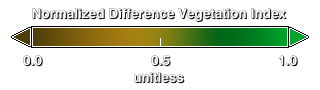
This color bar shows the Normalized Difference Vegetation Index colors ranging from brown (low) to bright green (high).
Credits
Please give credit for this item to:
NASA/Goddard Space Flight Center Scientific Visualization Studio
The Blue Marble data is courtesy of Reto Stockli (NASA/GSFC).
-
Visualizer
- Cindy Starr (Global Science and Technology, Inc.)
-
Animators
- Greg Shirah (NASA/GSFC)
- Alex Kekesi (Global Science and Technology, Inc.)
- Tom Bridgman (Global Science and Technology, Inc.)
Release date
This page was originally published on Saturday, March 17, 2007.
This page was last updated on Wednesday, May 3, 2023 at 1:55 PM EDT.
Missions
This visualization is related to the following missions:Datasets used in this visualization
-
[GOES: IR4]
ID: 33 -
[Terra: MODIS]
ID: 116 -
Daily L3 6.25 km 89 GHz Brightness Temperature (Tb) [Aqua: AMSR-E]
ID: 236 -
Sea Ice Concentration (Daily L3 12.5km Tb, Sea Ice Concentration, and Snow Depth) [Aqua: AMSR-E]
ID: 237 -
Sea Surface Temperature [Aqua: AMSR-E]
ID: 238 -
NDVI [NOAA: AVHRR]
ID: 426 -
CO Mixing Ratio [Terra: MOPITT]
ID: 506 -
Blue Marble Land Cover [Terra and Aqua: MODIS]
ID: 510Credit: The Blue Marble data is courtesy of Reto Stockli (NASA/GSFC).
See all pages that use this dataset
Note: While we identify the data sets used in these visualizations, we do not store any further details, nor the data sets themselves on our site.
Related
- ID: 10852
 Produced Video