TRMM Satellite and TMI Swath
The Tropical Rainfall Measuring Mission (TRMM) satellite was launched on November 27, 1997, as a joint mission of NASA and the Japan Aerospace Exploration Agency, JAXA. TRMM has five Earth-observing instruments on board and circles the Earth every 92 minutes in an equatorial orbit between 35 degrees north and south latitude so that those instruments can measure precipitation in the tropics. One of the instruments, TMI, observes five frequencies of microwave emissions in a 780-kilometer wide swath along the orbit in order to measure the amount of rain and ice in the atmosphere. This animation shows the TRMM satellite orbiting for one day, August 27, 2005, showing a set of TRMM measurements at a frequency of 85.5 GHz. In this frequency band, atmospheric ice crystals scatter microwaves and so areas with ice crystals appear colder than areas with no ice. Both Hurricane Katrina, just to the west of Florida in the Gulf of Mexico, and Typhoon Talim, in the westerm Pacific between Japan and New Guinea, show up as bright swirling patterns. This measurement is just one of the TMI measurements that go into calculating the total instantaneous rainfall in the tropics.
This animation shows the TRMM satellite orbiting the Earth on August 27, 2005 by revealing TMI 85.5 GHz microwave measurements for that day. This animation is on a cartesian map projection, so the satellite will look accurate only when the animation is wrapped to a sphere.
This product is available through our Web Map Service.
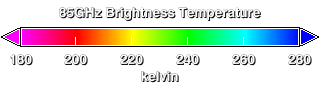
Legend for the TRMM TMI microwave measurements.
Credits
Please give credit for this item to:
NASA/Goddard Space Flight Center Scientific Visualization Studio
-
Animator
- Horace Mitchell (NASA/GSFC)
-
Scientist
- Jeff Halverson (JCET UMBC)
Release date
This page was originally published on Tuesday, April 4, 2006.
This page was last updated on Wednesday, May 3, 2023 at 1:55 PM EDT.
Missions
This visualization is related to the following missions:Series
This visualization can be found in the following series:Datasets used in this visualization
-
[TRMM: TMI]
ID: 110
Note: While we identify the data sets used in these visualizations, we do not store any further details, nor the data sets themselves on our site.