Hurricane Wilma — SSTs and Clouds
This visualization shows sea surface temperatures and clouds for Hurricane Wilma. The data is from October 15 through 20, 2005. The colors on the ocean represent the sea surface temperatures, and satellite images of the hurricane clouds are laid over the temperatures to clearly show the hurricane positions. Orange and red depict regions that are 82 degrees F and higher, where the ocean is warm enough for hurricanes to form. Hurricane winds are sustained by the heat energy of the ocean, so the ocean is cooled as the hurricane passes and the energy is extracted to power the winds. The sea surface temperatures are 3-day moving averages based on the AMSR-E instrument on the Aqua satellite, while the cloud images were taken by the Imager on the GOES-12 satellite.
Hurricane Wilma clouds and sea surface temperatures

Hurricane Wilma on Oct 20 at 13:34 GMT
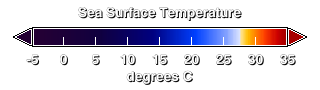
Sea surface temperature color bar (blue is about 20 degrees C and less, red is about 30 degrees C and higher)
Credits
Please give credit for this item to:
NASA/Goddard Space Flight Center Scientific Visualization Studio
-
Animators
- Greg Shirah (NASA/GSFC)
- Alex Kekesi (Global Science and Technology, Inc.)
-
Scientists
- J. Marshall Shepherd (NASA/GSFC)
- Jeff Halverson (JCET UMBC)
Release date
This page was originally published on Friday, October 21, 2005.
This page was last updated on Wednesday, May 3, 2023 at 1:56 PM EDT.
Missions
This visualization is related to the following missions:Series
This visualization can be found in the following series:Datasets used in this visualization
-
[Aqua: AMSR-E]
ID: 4For more information, please click http://wwwghcc.msfc.nasa.gov/AMSR/
See all pages that use this dataset -
[GOES: IR4]
ID: 33 -
Blue Marble [Aqua: MODIS]
ID: 252Credit: The Blue Marble data is courtesy of Reto Stockli (NASA/GSFC).
See all pages that use this dataset -
Blue Marble [Terra: MODIS]
ID: 492Credit: The Blue Marble data is courtesy of Reto Stockli (NASA/GSFC).
See all pages that use this dataset
Note: While we identify the data sets used in these visualizations, we do not store any further details, nor the data sets themselves on our site.