Hurricane Rita's Hot Towers
NASA's TRMM spacecraft allows us to look under Hurricane Rita's clouds to see the rain structure on September 19, 2005 at 15Z. Spikes in the rain structure known as 'hot towers' indicate storm intensity. 'Hot Towers' refers to tall cumulonimbus clouds and has been seen as one of the mechanisms by which the intensity of a tropical cyclone is maintained. Because of the size (1-20 km) and short duration (30 minute to 2 hours) of these hot towers, studies of these events have been limited to descriptive studies from aircraft observations, although a few have attempted to use the presence of hot towers in a predictive capacity. Before TRMM, no data set existed that could show globally and definitively the presence of these hot towers in cyclone systems. Aircraft radar studies of individual storms lack global coverage. Global microwave or Infrared sensor observations do not provide the needed spatial resolution. With a ground resolution of 5 km, the TRMM Precipitation Radar provided the needed data set for examining the predictive value of hot towers in cyclone intensification. At the time the data was taken, this storm was classified as a Tropical Storm with winds off 55 knots and a pressure of 994mb. The existence of these 18 km towers in the eye wall alerted researchers that this storm was going to rapidly intensify. Within 48 hours of this data set, the storm was a very strong category 4 hurricane.
The TRMM spacecraft's Precipation Radar (PR) instrument observed 18 km towers in the eye wall of Hurricane Rita.

Hurricane Rita's towers with the storm's clouds removed.
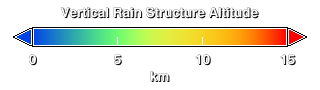
Hurricane Rita's vertical rain structure in kilometers. The high towers are shown in red.
Credits
Please give credit for this item to:
NASA/Goddard Space Flight Center
Scientific Visualization Studio
-
Animators
- Lori Perkins (NASA/GSFC)
- Greg Shirah (NASA/GSFC)
-
Scientist
- Jeff Halverson (JCET UMBC)
Release date
This page was originally published on Wednesday, September 21, 2005.
This page was last updated on Wednesday, May 3, 2023 at 1:56 PM EDT.
Missions
This visualization is related to the following missions:Series
This visualization can be found in the following series:Papers used in this visualization
http://www.nasa.gov/centers/goddard/news/topstory/2004/0112towerclouds.html
Datasets used in this visualization
-
[TRMM: PR]
ID: 109 -
[TRMM: TMI]
ID: 110 -
[TRMM: VIRS]
ID: 111
Note: While we identify the data sets used in these visualizations, we do not store any further details, nor the data sets themselves on our site.