Hurricane Katrina Rain Accumulation (WMS)
This animation shows rain accumulation from Hurricane Katrina from August 23 through 30, 2005 based on data from the Tropical Rainfall Measuring Mission (TRMM) Multisatellite Precipitation Analysis. Satellite cloud data from NOAA/GOES is overlaid for context. The accumulation is shown in colors ranging from green (less than 30 mm of rain) through red (80 mm or more). The TRMM satellite, using the world's only spaceborne rain radar and other microwave instruments, measures rainfall over the ocean.
GOES-12 infrared imagery over TRMM rainfall accumulation for Hurricane Katrina, from August 23, 2005 to August 30, 2005.
This product is available through our Web Map Service.
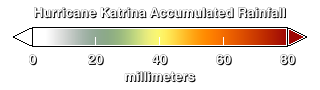
The legend for rainfall accumulation.
Credits
Please give credit for this item to:
NASA/Goddard Space Flight Center Scientific Visualization Studio
-
Animators
- Greg Shirah (NASA/GSFC)
- Lori Perkins (NASA/GSFC)
- Alex Kekesi (Global Science and Technology, Inc.)
-
Scientists
- Jeff Halverson (JCET UMBC)
- J. Marshall Shepherd (NASA/GSFC)
Release date
This page was originally published on Wednesday, October 5, 2005.
This page was last updated on Sunday, November 12, 2023 at 10:00 PM EST.
Missions
This visualization is related to the following missions:Series
This visualization can be found in the following series:Datasets used in this visualization
-
Blue Marble [Aqua: MODIS]
ID: 252Credit: The Blue Marble data is courtesy of Reto Stockli (NASA/GSFC).
See all pages that use this dataset -
Infrared [GOES-12: Imager]
ID: 316 -
Blue Marble [Terra: MODIS]
ID: 492Credit: The Blue Marble data is courtesy of Reto Stockli (NASA/GSFC).
See all pages that use this dataset -
3-hour Rainmap (3B4XRT) [TRMM and DMSP: SSM/I and TMI]
ID: 526This dataset can be found at: http://cics.umd.edu/~msapiano/PEHRPP/3b42rt.html
See all pages that use this dataset
Note: While we identify the data sets used in these visualizations, we do not store any further details, nor the data sets themselves on our site.