TOPEX/JASON Sea Level
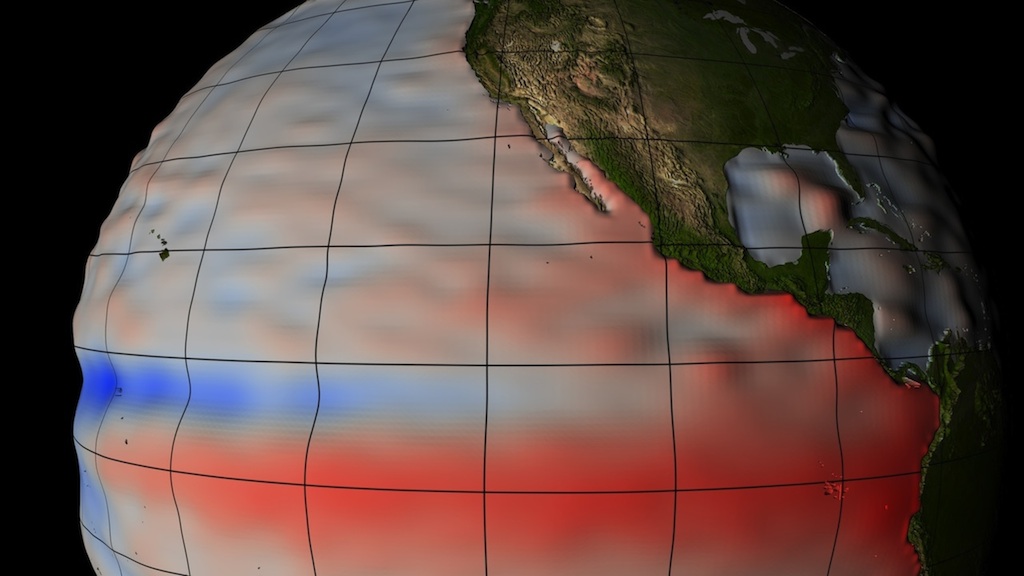
This visualization shows the relative sea level around the Earth. Sea level is represented by both color (blue=low, red=high) and bumpiness. The range is -500 mm to +500 mm.
Spinning globe showing TOPEX/JASON sea level data

Color bar for TOPEX/JASON sea level: -500mm is blue, 0mm is gray, +500m is red
TOPEX sea level in Eastern Equatorial Pacific from 04 December 1997 (El Niño)
TOPEX sea level of the Altantic Ocean on 14 January 1996
For More Information
Credits
Please give credit for this item to:
NASA/Goddard Space Flight Center Scientific Visualization Studio
-
Animator
- Greg Shirah (NASA/GSFC)
-
Scientist
- Akiko Hayashi (NASA/JPL CalTech)
-
Writer
- Michael Starobin (HTSI)
Release date
This page was originally published on Friday, July 29, 2005.
This page was last updated on Wednesday, May 3, 2023 at 1:56 PM EDT.
Series
This visualization can be found in the following series:Datasets used in this visualization
-
Sea Surface Height [Jason-1: Altimeter]
ID: 332 -
Sea Surface Height [TOPEX: Poseidon]
ID: 513
Note: While we identify the data sets used in these visualizations, we do not store any further details, nor the data sets themselves on our site.
Related
- ID: 11241
 Produced Video