Solar Irradiance (WMS)
The Earth's climate is determined by energy transfer from the sun to the Earth's land, oceans, and atmosphere. As the Earth moves around the sun, the fact that the Earth's axis is tilted means that the sun's overhead position moves from the Northern Hemisphere to the Southern Hemisphere and back from one summer to the next. This effect causes winters to be cold and summers warm in the Northern Hemisphere and the opposite in the Southern Hemisphere. This animation shows the incoming solar irradiance on the Earth at noon on the Greenwich meridian during an entire year, illustrating this movement. The magnitude of this irradiance comes from measurements by the TIM instrument on SORCE. Since the Earth's orbit is elliptical, the magnitude of the solar irradiance at the Earth is least when the Earth is farthest from the sun and greatest when the earth is closest. This 6 or 7 percent change can be seen in the animation by watching the dark bands move. When the bands expand from the bright spot, the Earth is getting closer to the sun, from July through December, and when they contract the Earth is moving away, from January through June. The sun's irradiance is also variable from day to day, but that effect is about ten times smaller than the effect of the earth's orbit.
This animation shows the solar radiance on the Earth
at noon on the Greenwich meriidian for June 20, 2003 through June 19, 2004
as calculated from measurements made by the TIM instrument on SORCE.
This product is available through our Web Map Service.
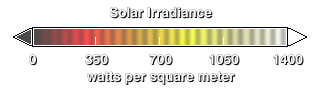
This is the legend for the solar irradiance animation, indicating the magnitude of the incident solar radiation flux.
For More Information
Credits
Please give credit for this item to:
NASA/Goddard Space Flight Center
Scientific Visualization Studio
-
Animator
- Horace Mitchell (NASA/GSFC)
-
Scientists
- Gary Rottman (University of Colorado/LASP)
- Tom Woods (University of Colorado)
Release date
This page was originally published on Tuesday, February 1, 2005.
This page was last updated on Wednesday, May 3, 2023 at 1:56 PM EDT.
Missions
This visualization is related to the following missions:Series
This visualization can be found in the following series:Datasets used in this visualization
-
Solar Irradiance [SORCE: TIM]
ID: 478
Note: While we identify the data sets used in these visualizations, we do not store any further details, nor the data sets themselves on our site.