Landsat 'Sees in the Dark' the Evolution of Antarctica’s Delaware-Sized Iceberg

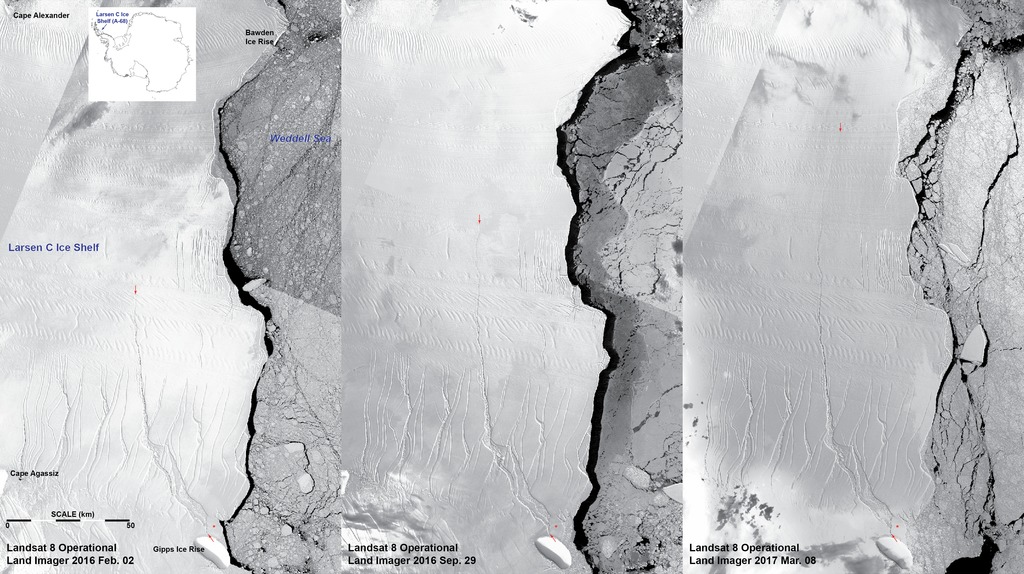
Evolution of Larsen C ice shelf leading up to and following the calving
While Antarctica was shrouded in darkness during the Southern Hemisphere winter, the Thermal Infrared Sensor (TIRS) on Landsat 8 captured a new snap of the 2,240-square-mile iceberg that calved from the Antarctic Peninsula’s Larsen C ice shelf on July 10-12, 2017. The fifth panel of satellite imagery is a composite of Landsat 8 as it passed on July 14 and July 21 and shows that the main berg, A-68A, has already lost several smaller pieces. The thick glacial ice from the A-68 iceberg will be carried by currents northward out of its embayment on the Larsen C ice shelf in much the same way that the smaller, shield-shaped A-57B iceberg can be seen moving in panels 3-5. The latest imagery also details a group of three small, not yet released icebergs at the north end of the embayment.
Scientists will have to wait until late August—the end of polar night in this part of the Antarctic Peninsula—to get their first natural-color images since the ~110-mile-long Larsen C rift became a complete break and released an iceberg about the size of Delaware or Prince Edward Island.
Imagery processed and annotated by Christopher A. Shuman, UMBC JCET at NASA Goddard.
Larsen C as seen by Landsat 8 on July 20, 2017
When a massive iceberg first broke away from Antarctica’s Larsen C ice shelf sometime between July 10-12, 2017, scientists knew it would eventually start breaking apart. That’s the normal life cycle of a drifting iceberg, which is at the mercy of the ocean’s battering currents, tides, and winds. Already those forces have turned A-68 into two named bergs, A-68A and A-68B, as well as a handful of pieces too small to be named by the U.S. National Ice Center.
The fractured berg and shelf are visible in these images, acquired on July 21, 2017, by the Thermal Infrared Sensor (TIRS) on the Landsat 8 satellite. The false-color view shows the relative warmth or coolness across the region. White indicates where the ice or water surface is warmest, most notably in the widening strip of mélange between the main iceberg and the remaining ice shelf. Dark grays and blacks are the coldest areas of ice.
So far, the calving and fracturing has taken place under the dark cover of polar night during Antarctica’s austral winter. That makes thermal imagery from satellites a critical tool for “seeing” the action. Adrian Luckman of the UK-based Project MIDAS first saw the berg break away in thermal data from the Moderate Resolution Imaging Spectroradiometer (MODIS), before Sentinel radar data became available later on July 12.
Scientists will have to wait until August—the end of polar night here—to get their first natural-color images since the long-growing Larsen C rift became a complete break.
For More Information
Credits
Please give credit for this item to:
NASA's Goddard Space Flight Center
-
Scientist
- Christopher Shuman (UMBC JCET)
-
Technical support
- Amy Moran (Global Science and Technology, Inc.)
-
Writers
- Kathryn Hansen (SSAI)
- Maria-Jose Vinas Garcia (Telophase)
Release date
This page was originally published on Thursday, August 3, 2017.
This page was last updated on Wednesday, November 15, 2023 at 12:38 AM EST.
Missions
This visualization is related to the following missions:Related
- ID: 30923
 Hyperwall Visual